Documentation
Everything you need to deploy, configure and operate MetaWiFi Aegis.
Video guides
The promo and the five-minute webinar play on the Media page.
Short videos, one feature each, recorded on a demo appliance. They are collected in the Aegis playlist on YouTube.
- Aegis in five minutes: the webinar. What Aegis watches, how it alerts and what it reports.
- A switch fails at 02:00. Who should know? Alert routing, standby duty and SIGNL4.
- Which switch ports are really in use? The port usage report.
- How available was the network? The availability report and the covering mail.
- Alerts, insights and closed. How the alert list is organised.
- A new switch, monitored in two minutes. Discovery and onboarding.
- The Catalyst Center appliance, watched. Cisco IMC hardware monitoring: power supplies, fans, disks and faults.
- Is ISE healthy? Nodes, certificates, backup and licensing of the ISE deployment.
- Planned work? Tell Aegis first. Maintenance windows on a site or a device.
- Sign in with the account you already have. SAML single sign-on.
- Cambium, without cnMaestro. The Cambium Networks module.
- A Catalyst switch, streaming in two minutes. Adding a telemetry switch, step by step.
- Add a firewall. Three fields. Adding a FortiGate.
- A remote site, without the plumbing. The Edge Monitor Gateway.
- Reach the machine behind the 4G router. Aegis RMS.
New videos are added to the same playlist.
System requirements
MetaWiFi Aegis runs as a self-contained on-prem appliance. Choose the tier that matches your environment size.
| Resource | Small | Medium | Large |
|---|---|---|---|
| Monitored devices | up to 150 | up to 500 | up to 2 000 |
| Peak wireless clients | up to 1 000 | up to 5 000 | up to 15 000 |
| CPU | 4 vCPU | 8 vCPU | 16-24 vCPU |
| Memory | 8 GB RAM | 16 GB RAM | 64 GB RAM |
| Disk | 100 GB SSD | 250 GB SSD | 1 TB NVMe SSD |
| Data retention | 90 days | 180 days | 365 days |
| Platform | OVA on VMware vSphere/ESXi/Workstation or Proxmox · installer on Ubuntu Server 20.04/22.04/24.04 (bare metal or VPS) · pre-configured physical appliance | ||
| Network access | Reachable from monitored devices; outbound internet for license validation | ||
80/443 (dashboard),
57500 (model-driven telemetry from switches and WLCs) and, only when Aegis RMS is enabled,
51820/udp plus 18100–18199 for the tunnels to the remote equipment
(robots, drones, any IoT device behind an RMS router). Outbound: HTTPS
(443) for license activation and application updates. Nothing else needs to reach the
appliance and the appliance calls nothing else.
Supported platforms
MetaWiFi Aegis supports Cisco switching and wireless, Fortinet firewalls, F5 load balancers, Infoblox DDI, Cambium Networks and Cisco IMC servers such as the Catalyst Center appliance. The table below lists which platforms are currently supported. Support is extended with each release: check this page for the latest status.
Wired: Cisco switching
| Platform | Status | Notes |
|---|---|---|
| Cisco Catalyst 9000 series 9200, 9300, 9400, 9500, 9600 |
Supported | Full SNMP polling, interface, environment and stack monitoring |
| Cisco Catalyst 4500-X | Supported | SNMP polling, interfaces, environment and uplinks |
| Cisco Nexus (NX-OS) Nexus 9000 standalone, 3000, 5000, 7000 |
Supported | SNMP polling, interfaces and environment. Onboarding over SSH uses the NX-OS syntax for the SNMPv3 user and the access list. Nexus 9000 in ACI mode is covered by the ACI integration instead. |
| Cisco Catalyst 2960-X / 2960-XR | Supported | End-of-life platform. Fully supported for existing deployments. |
| Other 2960 variants 2960, 2960-S, 2960-Plus |
Not yet supported | Planned for a future release |
Wireless: Cisco controllers
| Platform | Status | Notes |
|---|---|---|
| Cisco WLC (AireOS) | Not supported | AireOS-based controllers are not supported |
| Cisco Catalyst 9800 (IOS-XE WLC) | Supported | Full wireless visibility via REST API |
Fabric: Cisco ACI
| Platform | Status | Notes |
|---|---|---|
| Cisco ACI / APIC | Supported | Fabric health, tenants and endpoints via APIC REST API. Firmware 5.x and later. |
Identity: Cisco ISE
| Platform | Status | Notes |
|---|---|---|
| Cisco Identity Services Engine | Supported | Deployment health via the ISE OpenAPI on the Primary PAN: node state, certificates, backups and licensing. ISE 3.1 and later. |
Firewalls
| Platform | Status | Notes |
|---|---|---|
| Fortinet FortiGate | Supported | Interface stats, HA state and system health via SNMP |
Load balancers
| Platform | Status | Notes |
|---|---|---|
| F5 BIG-IP | Supported | Virtual server state, pool member health and system metrics via SNMP |
DNS / DHCP (DDI)
| Platform | Status | Notes |
|---|---|---|
| Infoblox NIOS grid members, physical and virtual (IB-1xxx, IB-V1xxx, IB-V5xxx) | Supported | HA and grid status, service checks of both nodes, DNS query rate and latency, DHCP counters and subnet utilisation via SNMP. NIOS 9.x verified. |
Servers: Cisco IMC
| Platform | Status | Notes |
|---|---|---|
| Catalyst Center appliance DN2-HW-APL, DN2-HW-APL-L, DN2-HW-APL-XL | Supported | Hardware health through the Cisco IMC over SNMPv3 or v2c: power supplies, fans, processors, memory, disks and virtual drives, temperatures, power draw and the Cisco IMC fault list. Verified on DN2-HW-APL-L with Cisco IMC 4.0. |
| UCS C-series rack servers standalone, with a Cisco IMC | Supported | The same readings as the Catalyst Center appliance, which is a UCS C220 or C480 itself. |
Cambium Networks
| Platform | Status | Notes |
|---|---|---|
| Enterprise Wi-Fi access points XV2, XV3, XE series | Supported | Standalone over SNMP, no cnMaestro needed: radios, channels, clients per radio and per SSID, CPU, memory, firmware, uptime and the wired uplink speed. Firmware 6.x and 7.x; the XE series includes the 6 GHz radio. |
| cnMatrix switches EX1000, EX2000, TX series | Supported | Ports with state and speed, PoE per port and budget, LLDP neighbours, firmware and uptime. Firmware 6.x. |
| Network Service Edge NSE 3000, NSE 4000 | Supported | CPU, memory, firmware, uptime and reachability. |
4G routers (Aegis RMS)
| Platform | Status | Notes |
|---|---|---|
| Teltonika RUT241 | Supported | LTE signal (RSRP, RSSI), operator, CPU, memory and modem temperature, with history; the endpoints behind it open from the dashboard over the Aegis RMS hub |
| Other Teltonika RutOS models RUT2xx, RUT9xx, RUTX | On request | Same operating system and provisioning; a busier site needs a bigger model, so confirm the model with us before ordering |
Deploy via OVA
The OVA is a pre-built virtual appliance for VMware vSphere, ESXi, Workstation or Proxmox. It contains Ubuntu Server, Docker and the Aegis services; no operating system installation is required. Every release is booted from the OVA and checked before it is published.
-
Download the OVA
Download the latest.ovafile from aegis.metawifi.nl/download/aegis-appliance.ova. By installing it you accept the End User License Agreement. -
Import into your hypervisor
In vSphere or ESXi: File → Deploy OVF Template and follow the wizard. In Proxmox: use the Import from OVF/OVA option under your storage node. Connect the network adapter to the VLAN from which the appliance can reach your devices and your devices can reach the appliance. -
Check the resources
The OVA is delivered with 12 vCPU, 32 GB RAM and a 500 GB thin-provisioned disk, which is the Medium to Large tier. Adjust them to the tier from System requirements before you power on; 4 vCPU and 8 GB RAM is the minimum. The disk only takes the space that is written to it. -
Power on and complete the setup wizard
On first boot a setup wizard starts on the console of the VM. It asks for the network settings and the first login, then downloads the application and starts it. See First boot.
metawifi, first password metawifi.
The first login asks for a new password straight away: type metawifi once more as the current
password, then your own password twice. Until then the appliance cannot be used from the console or over SSH
with the default password. The dashboard login is a separate account, the one you choose in the wizard.
Install on Ubuntu Server / VPS
No hypervisor? The installer sets up the same stack as the OVA on any Ubuntu Server 20.04, 22.04 or 24.04, bare metal or a VPS. It installs Docker, reads the stack definition out of the release image (so a script install and an OVA of the same release are identical) and walks you through the same configuration wizard.
-
Generate your install command
Click Get install command under Get started. You get a one-line command with a personal download token; the command is valid for 72 hours. By installing you accept the End User License Agreement. -
Run it as root on the server
curl -fsSL "https://aegis.metawifi.nl/install?token=…" -o install.sh && sudo bash install.sh
The wizard asks for the network settings, the dashboard login and the InfluxDB credentials. -
Start the stack
cd /opt/metawifi-aegis && docker compose pull && docker compose up -d, then open the dashboard on the server's address and activate your licence under Admin → License.
install.sh on an existing install refreshes the
host-side scripts and the stack definition to the current release without touching your configuration.
Physical appliance
MetaWiFi Aegis is also available as a pre-configured physical appliance: rack-mounted hardware with the software pre-installed and ready to deploy.
The appliance ships with all required services configured. Connect it to your network, power it on, and follow the First boot steps. A license is ordered separately and activated via Admin → License.
To order an appliance, use the contact form and select Appliance: physical hardware unit.
Prerequisites
Before deploying Aegis, verify the following network conditions are in place. Aegis must be able to reach your monitored devices, and your devices must be able to reach Aegis for telemetry delivery.
Reachability from Aegis to devices
| Protocol | Port | Direction | Purpose |
|---|---|---|---|
| ICMP | - | Aegis → devices | Device availability and latency checks |
| SSH | TCP 22 | Aegis → devices | Onboarding: read-only audit or automated config push |
| SNMP | UDP 161 | Aegis → devices | Polling metrics, interfaces, environment |
| HTTPS | TCP 443 | Aegis → WLC / APIC | Wireless controller and ACI API polling |
| HTTPS | TCP 443 | Aegis → ISE PAN | Cisco ISE OpenAPI polling (primary and secondary Administration Node) |
Reachability from devices to Aegis
| Protocol | Port | Direction | Purpose |
|---|---|---|---|
| SNMP Trap | UDP 162 | Devices → Aegis | Real-time event delivery (optional) |
| Syslog | UDP 514 | Devices → Aegis | Log-based telemetry (optional) |
| gRPC (Telemetry) | TCP 57500 | Devices → Aegis | Cisco streaming telemetry dial-out (Catalyst / WLC) |
| ORB relay | TCP 8095 | ORB agents → Aegis | ORB agent telemetry forwarding |
Outbound from Aegis to the internet
| Protocol | Port | Direction | Purpose |
|---|---|---|---|
| HTTPS | TCP 443 | Aegis → licence server | Licence activation, the periodic licence check and updates |
| WireGuard | UDP 51820 | Aegis → MetaWiFi hub | Aegis RMS tunnel to the hub address you receive at onboarding (only with RMS) |
| WireGuard | UDP 51820 | Aegis → support.metawifi.nl | Support access tunnel, only while support access is switched on |
Nothing else leaves your network: no telemetry, metrics or device data. Both tunnels are opened by the appliance, so no inbound port is needed for them.
Dashboard access
| Protocol | Port | Direction | Purpose |
|---|---|---|---|
| HTTP / HTTPS | TCP 80 / 443 | Browser → Aegis | Dashboard access |
| HTTPS | TCP 443 | Aegis → internet | License validation |
First boot
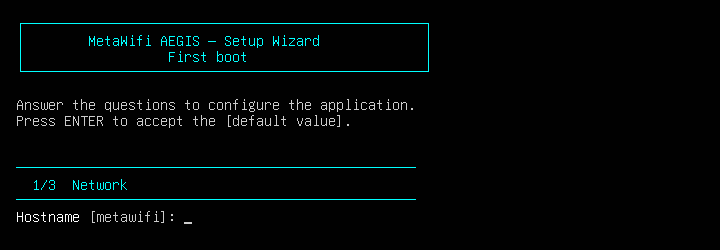
When the appliance starts for the first time, a setup wizard runs on the console of the VM (the vSphere or Proxmox console, or the screen of a physical appliance). It takes about two minutes of questions; press Enter to accept the value shown in brackets.
- Network
Hostname, then the IP address. Leave the IP address empty for DHCP, or enter an address, subnet mask or prefix, gateway and DNS server for a static address. An NTP server is optional; leave it empty to use the default pool. Accurate time matters for the database and for TLS, so on a closed network enter your internal NTP server. - Local login
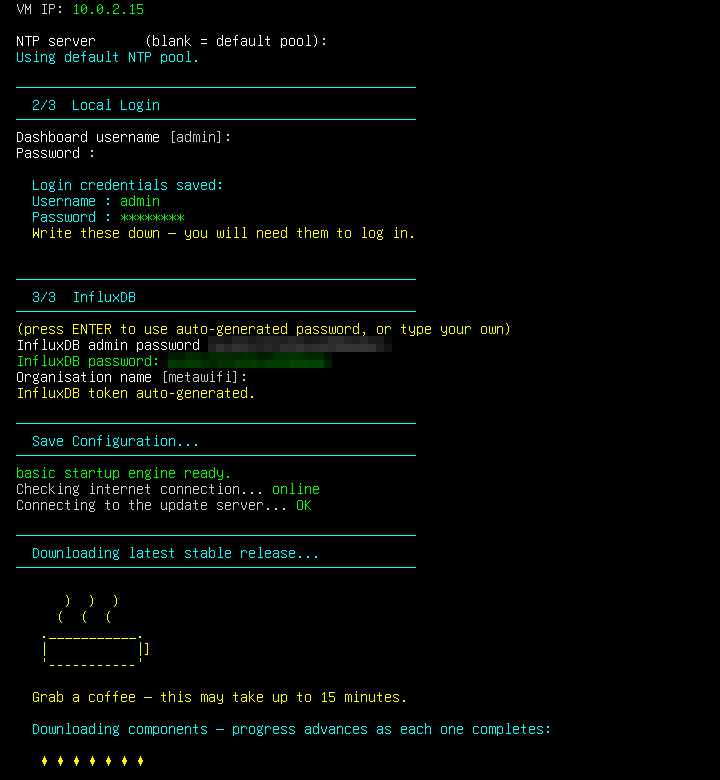
The username and password for the dashboard. This account is the first administrator; you can add users and connect LDAP or SAML later under Users & access. - Database
A password for the built-in database is generated for you; press Enter to keep it. The organisation name is shown in the dashboard and defaults tometawifi.
The wizard then checks the internet connection, logs in to the update server and downloads the application images. This takes a few minutes on a fast line and up to fifteen on a slow one. The services start automatically once the download is complete.
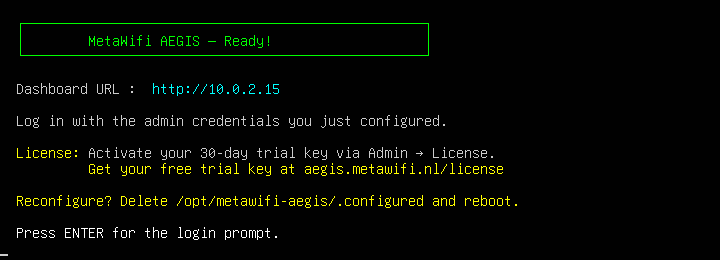
Open the address shown in a browser and log in with the dashboard account you just created. Press Enter on the console to get the normal login prompt; the wizard does not run again.
After the wizard
- Set the appliance password
Press Enter on the console and log in asmetawifiwith passwordmetawifi. The appliance asks for a new password right away: entermetawifias the current password, then your own password twice. This is the password for the console and SSH, not for the dashboard. Keep it with your other system passwords: it is needed for updates without internet and for support. - Activate your license
Go to Admin → License and enter your license key or a free 30-day trial key. See License activation. - Set up HTTPS (recommended)
A fresh appliance serves the dashboard over HTTP. If the appliance has a DNS name, HTTPS can be configured from the admin panel under Admin → Settings → HTTPS. - Enter your polling settings and add devices
See Network & polling and Adding devices.
sudo /opt/metawifi-aegis/update-aegis.sh to download the application and start it.
To run the wizard again, delete /opt/metawifi-aegis/.configured and reboot.
License activation
Aegis requires a license key to operate beyond the free tier. License keys are entered and managed via Admin → License in the dashboard.
Trial license
A 30-day trial license key is available immediately at aegis.metawifi.nl/license. It gives full access to all features for 30 days. No credit card required.
PRO license
After purchasing a PRO license you will receive your license key by email. Enter it in Admin → License and click Activate. The dashboard will confirm the tier and device limit immediately.
What counts as a device
Your tier sets how many devices Aegis monitors at once. Each of these takes one slot: a switch (SNMP, telemetry or ACI), a wireless controller, a firewall, a load balancer, a Cisco ISE node, an Infoblox member, a Cisco IMC server, a Cambium cnMatrix switch or NSE gateway, and a Teltonika router, whether it is an Aegis RMS gateway or an Edge Monitor Gateway. The IoT endpoints behind such a router are free: Aegis polls the router, not the endpoint. Access points never count: Cisco access points come with their controller, and Cambium access points are free as well.
Beyond the limit nothing breaks: the devices over the line are greyed out and left unpolled, and the License tab shows exactly which ones. Raise the tier and they start reporting on the next cycle, without re-onboarding.
Network & polling
Aegis polls your network devices to collect telemetry. All polling happens from the Aegis server, no agents are installed on the monitored devices.
Supported protocols
- SNMP v2c / v3: switches and routers
- Cisco WLC API: wireless LAN controllers
- Cisco ACI REST API: ACI fabric environments (optional)
- SSH: device onboarding and automated configuration push (optional)
Poll intervals
Aegis uses different collection methods and intervals depending on the data type and platform.
| Data type | Platform | Method | Interval |
|---|---|---|---|
| Reachability | All switches | Aegis checks the device (ICMP, TCP port 22 as fallback) | Every minute |
| Interfaces, PoE | Catalyst 9000 (streaming telemetry) | Device pushes to Aegis | About every 100 seconds |
| CPU, memory, environment | Catalyst 9000 (streaming telemetry) | Device pushes to Aegis | Every 5 minutes |
| Health, interfaces, environment, bandwidth | Switches (SNMP) | Aegis polls device | About 5 minutes, also on networks with hundreds of switches |
| Controllers, APs & clients | Cisco WLC (9800) | Aegis polls WLC API | 60 seconds |
| Fabric health, tenants & endpoints | Cisco ACI / APIC | Aegis polls APIC API | 60 seconds (configurable) |
The SNMP interval can be tuned under Admin → Advanced. Bandwidth history is kept for 30 days.
How fast is a failure visible?
From the moment of the failure to the moment the dashboard and the alert list show it, measured on a network with hundreds of switches. A short blip does not turn a switch red; a device has to stay silent for a while before it is marked offline.
| What happens | Visible on the dashboard |
|---|---|
| A switch goes down or reboots | Within 2 minutes, whichever way it is monitored |
| An uplink goes down on a switch with streaming telemetry | Within 5 minutes, usually 3 |
| An uplink goes down on an SNMP-only switch | Within 5 minutes |
| A switch comes back | Within a minute |
Polling targets are added under Admin → Add / Discover: a hostname, an IP, a range or a subnet in one form. See Adding devices. Global SNMP credentials are configured under Admin → Settings → SNMP Configuration (see Before you onboard); individual devices can override them in their own form. Poll intervals can be tuned under Admin → Advanced.
Users & access
Aegis uses role-based access control (RBAC) to manage who can view and change what in the dashboard. There are three ways to sign in: a local account with a password and a one-time code from an authenticator app (see Two-factor authentication), Active Directory over LDAP, or an identity provider over SAML single sign-on.
The local install user
During installation, a local system user is created automatically. This user serves as a fallback login, used to reach the dashboard before any accounts exist. It is retired automatically by the first local administrator who can actually sign in: a viewer, or an invitation nobody has accepted yet, leaves it available, because otherwise the appliance would be left with no administrator at all.
Inviting a user
Accounts are created by invitation, so a password is never chosen on someone else's behalf and never travels through an inbox or a chat message. Under Admin → Settings → Local Users, enter a username, an email address and a role, and press Send invitation.
-
The invitation is emailed, and shown
The link is always displayed in the admin panel as well. An appliance in a closed network has no mail server, and mail that lands in a spam folder needs a way out: copy the link and pass it on however you like. -
Tell the person what to expect
A first message from an unfamiliar sender often lands in a junk folder, and mail clients filter per user: an address your own Outlook has learned to trust is still new to theirs. Mention the sender address you send from and that it may be in their junk folder, or simply pass the link along through whatever channel you are already talking on. -
The user sets their own password
The link works once and expires after 72 hours. Issue a fresh one with Resend; the previous link stops working at that moment. -
Administrators enrol a second factor
Required, not offered. Until it is done, that account reaches the enrolment page and nothing else, even if the invitation was abandoned halfway and completed at the next sign-in. Viewers may skip it.
User groups
| Group | Access level |
|---|---|
| Admin | Full access: dashboards, alerts, admin panel, users, license, integrations, updates and settings |
| Monitor | Read-only access to dashboards and alerts, plus operating IoT endpoints: moving the local Wi-Fi link between machines and opening a machine's own page. No access to the admin panel or settings. |
Users are created and managed in Admin → Users. Assign the Monitor group to operators who only need visibility, and the Admin group to users who manage the platform.
Instead of maintaining accounts in Aegis, you can hand authentication to your own identity provider: Active Directory over LDAP, or an identity provider such as Entra ID or Okta over SAML single sign-on. In both cases group membership decides the role, and no passwords are stored in Aegis.
Two-factor authentication
Local accounts can be protected with a second factor: a six-digit code from an authenticator app such as Google Authenticator or Microsoft Authenticator. It is optional per user: while it is off, a reminder appears at the top of the dashboard.
Turning it on
-
Open Two-factor auth in the sidebar
Or follow the reminder banner. The page is available to every local account, including viewers. -
Scan the QR code
Press Enable and scan the code with your authenticator app. If the camera is unavailable, the key is shown as text for manual entry. -
Confirm with a code
Type the six digits the app shows. Two-factor is switched on only after a code has been accepted, so a mis-scanned QR can never lock you out. -
Store the recovery codes
Ten single-use codes are shown once. Keep them somewhere safe, they are your way in when the phone is unavailable.
Signing in
After the password, Aegis asks for the current code. A recovery code works in the same field and is used up once. Each code is valid for its time step only; the same code cannot be replayed.
Lost phone
Use a recovery code to sign in, then re-enrol from the same page. If no recovery code is left, an administrator can clear two-factor for that account under Admin → Users, after which the user signs in with their password and enrols again.
Password expiry
A local password expires after 90 days, with reminders by email as the date approaches. Enrolling an authenticator switches that expiry off: rotating a password guards against it quietly ageing into someone else's hands, which is what the second factor already covers, and forced rotation mostly produces the same word with a rising number on the end.
The original date is kept rather than erased. Switching the authenticator off again therefore exposes the real age of the password instead of granting a fresh 90 days.
app.env is deliberately outside this: it has no record to hold a
secret and stays available as a way in when every other account is unreachable.
Support access
When you need help, you can let MetaWiFi look at your Aegis without a screen-sharing session and without handing over your credentials. Under Admin → Support you decide for how long, whether the console of the appliance host may be reached as well, and you switch it on. Everything else happens by itself. Available from version 1.4.127 on an appliance with an activated licence.
- Switch support access on
Choose the period: 24 hours, 7 days, 30 days, or until you switch it off. Console access is off unless you tick it. On switching on, the appliance pairs itself with MetaWiFi (it sends its tunnel key together with its licence, and receives its tunnel address and the hub details in return) and opens an outbound tunnel to the MetaWiFi support hub. You open no inbound port; the appliance only needs to reachsupport.metawifi.nlon UDP port 51820. Nothing about keys, addresses or the hub is shown or typed. - Pass on the one-time password
Aegis creates the administrator accountmetawifi-supportwith a random password that is shown once. Give it to MetaWiFi. It works only through the support tunnel and stops working when the period ends or you switch support off. - Switch it off whenever you like
A banner on every page shows that support access is on and until when. The Support tab shows whether MetaWiFi is connected and whether console access is allowed. Switching off, or the end of the period, closes the tunnel and removes the account. Switching on again creates a new password; the pairing is kept.
SSH access
Aegis can connect to your network devices over SSH for onboarding purposes. SSH credentials are configured in Admin → Settings → SSH and applied per device or subnet.
Read-only SSH
In read-only mode Aegis connects to devices to audit the current configuration: for example, to verify which SNMP community strings are active or to check the existing telemetry configuration. No changes are made to the device.
Read/write SSH (onboarding)
In read/write mode Aegis can push configuration to devices automatically during onboarding. This includes:
- SNMP community string configuration
- Telemetry configuration (streaming telemetry towards the Aegis platform)
This allows you to onboard a new device in a single step without manually logging into each switch or router. Aegis generates a change preview before applying anything: you confirm before the push is executed.
Before you onboard
Get started by filling in a few global settings before you onboard your first device. These live under Admin → Settings and are reused for every device you add, so configuring them once up front turns onboarding into a single confirmation step instead of re-entering details each time.
| Setting | Needed before onboarding? | Why it matters |
|---|---|---|
| SNMP Configuration | Required | The SNMPv3 credential set Aegis provisions on each switch and then uses to poll it. Switch onboarding is blocked until the allowed-source list is set. |
| Telemetry Receiver | Required | Where Catalyst 9000 switches and the 9800 WLC stream gRPC telemetry. Set it before onboarding any telemetry-capable device so the pushed subscription points at the right address. |
| SSH Credentials | Optional | Used to push configuration during onboarding. Set them globally for one-step bulk onboarding, or leave them blank and enter one-off credentials in the onboarding form instead. |
1. SNMP Configuration (required)
Configured under Admin → Settings → SNMP Configuration. Switches are always SNMPv3: Aegis creates this user on each switch during onboarding (authPriv) and then uses it to poll. Firewalls and load balancers inherit the same v3 set unless you give them their own credentials later.
| Field | Description |
|---|---|
| SNMP User / Group / View | Names of the SNMPv3 user, group and view Aegis creates on the switch (defaults: AEGIS / AEGIS-GRP / AEGIS-VIEW). |
| ACL Name | Name of the access list applied to the SNMP user on the switch. |
| Allowed sources | Comma-separated wildcard entries (e.g. 10.0.10.0 0.0.0.255). Must include the Aegis server's IP or subnet: each entry becomes a permit in the SNMP ACL. |
| Auth protocol + password | SNMPv3 authentication: SHA, SHA-256 or MD5. |
| Priv protocol + password | SNMPv3 privacy / encryption: AES-128, AES-256 or DES. |
2. Telemetry Receiver (required for streaming telemetry)
Configured under Admin → Settings → Telemetry Receiver. Catalyst 9000 switches and the Catalyst 9800 WLC stream gRPC telemetry to Aegis (faster than SNMP polling: see Network & polling). Set the receiver before onboarding these devices so the subscription Aegis pushes points at the right address. Legacy SNMP-only switches do not use this.
| Field | Description |
|---|---|
| Receiver host / IP | The Aegis server address devices stream to. Must be reachable from your devices on TCP 57500: see Prerequisites. |
| Port | gRPC telemetry port (default 57500). |
| Receiver name | Name used in the telemetry receiver protocol <name> config on the switch (e.g. METAWIFI_RECEIVER). |
| WLC receiver IP / port | Leave blank to reuse the switch receiver. Set only if WLCs must stream to a different address than switches. |
| Default management interface | Interface whose IP becomes the gRPC source-address in the pushed subscription (e.g. Loopback0, Vlan1). Can be overridden per switch during onboarding. |
3. SSH Credentials (optional)
Configured under Admin → Settings → SSH Credentials. SSH is how Aegis pushes configuration during onboarding (the SNMP user, telemetry subscriptions). You do not have to set this globally, you can leave the fields blank and type one-off credentials into the onboarding form, where they are used only for that session and never stored. Set them globally when you want to onboard many devices in one step without re-typing. See SSH access for the read-only vs read/write distinction.
| Account | Access needed | Used for |
|---|---|---|
| Switch SSH | Write / enable | Pushes the SNMPv3 user (and telemetry config) onto switches during onboarding. |
| WLC SSH | Read-only | Catalyst 9800 discovery and the telemetry subscription push. |
| Telemetry SSH | Write | Pushes MDT telemetry subscriptions. Falls back to Switch SSH when left blank. |
| Discover Topology SSH | Read-only | CDP/LLDP topology discovery and subnet scans. Falls back to Switch SSH when left blank. |
| DNS domain suffix (optional) | - | Appended to bare hostnames for all SSH connections. No effect when an IP address is already known. |
Adding devices
All device management lives under Admin → Add / Discover. From here you add switches (one, a range or a subnet), controllers, firewalls, load balancers and routers, and review or remove existing inventory.
Add Switch(es)
One form for one switch or many. Enter a hostname, a single IP, an IP range (10.1.1.1-50)
or a subnet (10.1.1.0/24, up to 512 addresses). Aegis connects to every address that answers
over SSH, reads the platform (show version) and decides per switch whether it gets streaming
telemetry (Catalyst 9000) or SNMP polling (other platforms).
- Enter the target and the site name the switches belong to.
- Optionally set the management interface for telemetry (e.g.
Loopback0); leave blank for the global default. It can still be changed per switch in the results. - Enter SSH credentials, or leave blank to use the saved Switch SSH account (Admin → Settings → SSH).
- Click Discover. Each switch found is listed once, on the address Aegis will use for it: the telemetry source address on a Catalyst 9000, the Vlan1 address for SNMP polling. A switch that answered on more addresses shows them as a note, not as extra switches.
- Per switch, click Push telemetry config or Add as SNMP switch. Aegis pushes the configuration and adds the switch to the inventory. Switches already in the inventory are marked and skipped.
When discovery cannot log in
A switch that answers but cannot be logged in to is still listed, with the reason underneath and the status no SSH or SSH failed:
| What you see | Most likely cause | What to check |
|---|---|---|
| Port 22 refused the connection | An access list on the VTY lines that does not permit the appliance, or SSH not enabled | The access-class on line vty and its ACL, and transport input ssh |
| Port 22 did not answer, the switch does answer ping | The same VTY access list, or a firewall or interface ACL that filters SSH on the way | The VTY ACL first, then the path between the appliance and the switch |
| The switch closed the SSH session before the login | An access list on the VTY lines: the switch accepts the connection and closes it straight away | The access-class on line vty |
| Authentication failed | Wrong SSH credentials | The Switch SSH account, or the credentials entered in the form |
Adding the appliance address to the VTY access list is usually all it takes. Run Discover again afterwards. Until then the switch can still be added for SNMP polling if SNMP is already configured on it.
Add WLC
Onboards a Cisco Catalyst 9800 Wireless LAN Controller. Aegis registers the WLC in the inventory and optionally pushes the streaming telemetry subscription via SSH so wireless metrics start flowing immediately.
- Enter the WLC IP, short name, site/group, and optionally the uplink switch IP.
- Pick the HA role: a primary controller, or the standby of a controller already in that site. Choose N+1 for a standalone controller the access points fall back to (polled like any controller, one licence slot) or SSO for the second chassis of an SSO pair (reached on its RMI address, ping only, no licence slot). The role can be changed later under Managed Devices.
- Enable Push telemetry config via SSH (recommended) to have Aegis configure the telemetry subscription automatically.
- Enter SSH credentials, or leave blank to use the saved WLC SSH account (read-only is sufficient for WLC).
- Click Add WLC.
Add Firewall
Monitors FortiGate firewalls via SNMP. No SSH access to the firewall is required. The firewall must be configured to accept SNMP queries from the Aegis IP.
- Enter the firewall name, IP address, site, and (optionally) model and maximum session capacity.
- Select the SNMP version, v2c (community string) or v3 (user/auth/priv).
- For v3: fill in the credentials, or leave the fields empty to inherit the global Firewall SNMP credential set (Admin → Settings → SNMP).
- Use Test SNMP to verify connectivity before saving.
- Click Save firewall. The firewall appears on the Wired page under its assigned site.
Add Load Balancer
Monitors F5 BIG-IP load balancers via SNMP. VIP status, concurrent connections, and SNAT pool statistics are collected every poll cycle. No SSH access is required.
- Enter the load balancer name, IP address, and site.
- Select SNMP v2c or v3 and provide credentials (or inherit from the global LB SNMP credential set).
- Use Test SNMP to verify, then click Save load balancer.
Add Infoblox
Monitors Infoblox NIOS grid members via SNMP. Add each member on its member address; for an HA pair that is the VIP, and the active node answers for both nodes. No SSH access is required.
- On the grid, enable SNMP queries under Grid → Grid Manager → Grid Properties → SNMP: a v2c community or a v3 user, and the appliance address in the list of allowed sources. Members with their own SNMP settings need the same there. Save, then Restart Services.
- In Aegis, enter the member name, address and site, pick v2c or v3 (or inherit the Infoblox credential set from Settings › SNMP).
- Use Test SNMP: it shows the hardware type and NIOS version when the Infoblox MIB answers. Then click Save Infoblox member.
Add Server (Cisco IMC)
Monitors the hardware of a Catalyst Center appliance or another UCS C-series server through its Cisco IMC, via SNMP. Add the server on the address of the Cisco IMC, not of its operating system.
- On the Cisco IMC, open Admin › Communication Services › SNMP, enable SNMP and add an SNMPv3 user with authentication (SHA) and privacy (AES). Click Save Changes: the user only works after that.
- In Aegis, enter the SNMPv3 user once under Settings › SNMP, in the Servers credential set. Every server then inherits it.
- Under Add Server, enter the name, the Cisco IMC address and the site. Use Test SNMP: it shows the model and the Cisco IMC version. Then click Save server.
Managed Devices
The Managed Devices accordion shows the full inventory: SNMP/Telemetry switches, WLCs, firewalls, load balancers, Infoblox members and servers. From here you can edit device settings or remove a device from monitoring.
Site overview
The dashboard opens on the Site overview: a health-based view of all monitored sites. Each site shows an overall health percentage, active alert count and a quick summary of wired and wireless status.
Sites are automatically grouped based on your polling configuration. A site's health score is derived from the combined state of all monitored devices at that location. Click a site tile to drill into device-level detail.
Health scoring
- Green (≥ 90%): all devices operating normally
- Yellow (70-89%): minor issues detected, services unaffected
- Red (< 70%): significant issues requiring attention
Widget tiles & NOC screen
Two tiles in the top row of the dashboard are yours to choose. They are meant for a NOC screen: put the figures there that your team wants to see at a glance, such as the internet uplink or the number of wireless clients.
An admin sets them with the gear icon in the corner of the tile. Every user and every screen sees the same two tiles; read-only users don't get the gear. The tiles refresh every minute.
| A tile can show | What you see |
|---|---|
| Interface bandwidth | Traffic in and out of one interface on a switch or a firewall, with the last 6 hours as a line. Choose the device, then the interface, and give the tile a title if you like, for example Internet uplink. |
| Wireless clients | The number of wireless clients on all controllers, or on one controller, with the last 6 hours. |
| Firewall sessions | The session count of all firewalls together, or of one. For a single firewall with a maximum session capacity set, the tile also shows how full it is. |
| Automatic | The default. With the Orb integration on, the tiles show impacted services and agents online; otherwise wireless clients and firewall sessions, when Aegis monitors those. |
On a NOC screen
- A NOC dashboard account. Give the screen its own read-only account and switch on NOC dashboard for it under Admin → Settings → Local Users. That account is never logged out for inactivity. Only a read-only account can be a NOC dashboard account.
- It says when the data stops. When Aegis does not answer for two minutes, or the screen was logged out after all, a red bar across the top says since when the data is not fresh.
- It updates itself. After an Aegis update, the page reloads by itself once nobody has touched it for two minutes.
Wireless monitoring
The wireless section provides visibility into your Cisco wireless infrastructure. It is organised around the controller (WLC) as the top-level object.
- Controllers: operational state, firmware version, client load
- Access points: per-AP health, uptime, channel and client counts
- Clients: connected clients per SSID and AP
- SSIDs: distribution across APs and client load
Access points are not individually licensed: only the WLC counts as a monitored device.
A second controller per site
A site with two controllers shows one controller, not two. Mark the second one as the standby of the first (in Add WLC, or afterwards in Admin → Add / Discover → Managed Devices) and it disappears from the controller list and the counts: the primary's row carries a line with the standby's name and state, and the primary's detail panel gets an HA block. For an N+1 standby that block shows reachability, software version, uptime and the access points and clients currently on it, which should be none. For an SSO pair it shows the peer state and the switchover count the active controller reports.
- Standby unreachable: a warning, or critical when the primary is down as well.
- APs on the standby: a warning, because a failover is in progress.
- Version mismatch: a warning when an N+1 standby runs another release than its primary.
- SSO peer not ready: a warning when the active controller reports its peer is not in standby-hot.
Wired monitoring
The wired section covers switches and uplinks across all monitored sites.
- Switch health: CPU, memory, temperature and power supply state
- Uplinks: traffic, errors and operational state
- Stack members: per-member state in stacked switch environments
- Environment: fan and temperature sensor readings where available
Health thresholds
A switch turns warning or critical on the dashboard, and raises the matching alert, when a reading crosses these limits. The temperature limits depend on which sensor the switch reports: the outlet (or the single chassis sensor of an older model) is what the gauge shows; a hotspot sensor runs 20 to 30 degrees hotter by design and is judged by Cisco's own limits for it.
| Reading | Warning | Critical |
|---|---|---|
| CPU (5-minute average) | 70% | 85% |
| Memory (processor pool) | 70% | 85% |
| Temperature, outlet or single chassis sensor | 65 °C | 75 °C |
| Temperature, hotspot sensor | 105 °C | 125 °C |
| Power supply | Critical when a supply reports a fault; a missing supply is ignored | |
Uplink rules
By default, Aegis identifies uplink interfaces on 2960X switches using a
Te* name heuristic. For all other platforms, and when you want
precise control, you can define uplink rules that map a
hostname pattern to an explicit list of interface names.
Rules are configured in Admin → Settings → Uplink Rules. Each rule has two required fields and two optional ones:
| Field | Required | Description |
|---|---|---|
| Pattern | Yes | Case-insensitive substring matched against the switch hostname. For example -bn- matches sw-bn-core-01. |
| Interfaces | Yes | Comma-separated list of interface names that count as uplinks for matching switches. You can enter the full name (FortyGigabitEthernet1/0/10) or Cisco shorthand (Fo1/0/10, Te1/1/1): entries are expanded to their full canonical form and de-duplicated when saved. |
| Model pattern | No | Additional substring match against the switch model string. Useful when the same hostname convention is used across different hardware generations. |
| Comment | No | Free-text label for your own reference, not used by the system. |
Matching behaviour
- A rule matches when all present fields match: if both Pattern and Model pattern are set, both must match.
- Multiple rules can match the same switch. The most specific match wins, the rule with the longest combined Pattern + Model pattern takes precedence. For example a specific
hq-access-06rule overrides a generic-en-rule for that switch. Only when several matching rules are equally specific are their interface lists combined (union). - When no rule matches, Aegis falls back to the built-in
Te*heuristic for 2960X switches. - Changes take effect within 30 seconds, no restart required.
Fo1/0/10, Te1/1/1) or
full form (FortyGigabitEthernet1/0/10), Aegis normalizes them to the full
canonical name when you save, so both forms of the same port are stored only once.
To check the names a switch uses, run show interfaces status.
Alerts
Aegis continuously evaluates collected telemetry and raises an alert when a threshold is exceeded or an operational state changes. Alerts are visible on the dashboard, on the site overview and in the Alerts tab within each site. Each alert shows when it started and how long it has been active. It clears by itself when the condition goes away.
Alerts, Insights and Closed
Not every condition deserves the same attention, so the active alert list has three tabs. The small i next to the heading repeats this in the dashboard itself.
| Tab | What it holds | Examples |
|---|---|---|
| Alerts | Something changed and asks for action. These count on the Active Alerts card, can escalate to SIGNL4 and can be mailed. | Device offline, uplink down, power supply redundancy lost, StackPower cable down, APs not joined, telemetry missing, high CPU or memory, temperature, fabric or firewall HA degraded |
| Insights | Standing conditions about capacity, cabling, versions or licences. Something to plan for, not to fix at three in the morning. They are listed under the card figure but do not count in it, and they never escalate to SIGNL4 and are never mailed, whatever the device's tag says. In the severity column they read Insight. | AP uplink negotiated at 100 Mbps, high 5 GHz utilization, standby controller on another release, CPU or memory elevated (70 to 84 %), ISE evaluation or unregistered licence, a certificate inside its 30-day warning |
| Closed | Alerts that on-call closed in SIGNL4 while the condition is still present in Aegis. They leave the card count, but stay visible until the condition clears, so nothing is hidden. | A lost power supply that the engineer closed because the replacement is ordered |
The tab follows the alert type. For the two-level detectors the lower level is the insight and the upper level the alert: memory at 79 % is an insight, at 90 % an alert; a certificate twenty days out is an insight, inside its critical window an alert. Severity itself is unchanged, and an insight still counts for the site health score. An alert that on-call has only acknowledged stays on the Alerts tab, greyed, because someone is on it but it is not done.
What keeps the list quiet
- Device offline is the root cause. When a device is itself unreachable, Aegis raises one device offline alert and suppresses its dependent alerts: uplink and backbone interfaces, access points and environmental readings.
- High 5 GHz utilization has to last. The AP list is fetched from the controller about once an hour. A radio busy for one poll is not listed; the insight appears once the AP has been above the threshold in two polls at least 30 minutes apart, and starts over when the radio calms down in between. The site health score applies the same rule.
- Cleared alerts linger briefly. An alert that disappears from one poll stays listed for 10 minutes (2 minutes for offline alerts) so a hiccup between two polls does not make it flap.
- Maintenance windows hide the alerts of a site or device from the list and from escalation for the duration; the list says how many are suppressed.
To escalate alerts to an on-call tool, see SIGNL4 alerting; for what happens to an alert from the moment it is raised to the moment it clears, see The life of an alert.
Firewalls & load balancers
Alongside switching and wireless, Aegis polls FortiGate firewalls and F5 BIG-IP load balancers over SNMP. Both appear on the Wired page and feed the same site health, alerting and history as the rest of the estate.
Firewalls
Per firewall you get CPU, memory, session count against the platform capacity, interface throughput and reachability. IPsec site-to-site is grouped per gateway rather than per phase-2, because a gateway with a dozen tunnels reads as one connection to the operator: status comes from the phase-2 entries and the traffic figures from the matching tunnel interface. SSL-VPN tunnels, users and web sessions are shown separately.
Load balancers
Virtual servers and SNAT pools are listed with availability, monitor state and concurrent connections. Star a VIP to pin it to the top, favourites are per user, and switch on monitoring for a VIP to have its transition to down raise an alert like any other device.
Infoblox DDI
Aegis polls Infoblox NIOS grid members over SNMP and shows them on the Wired page under their site, next to the switches and firewalls of that site. One member address is enough for an HA pair: the active node answers and reports the checks of the passive node as well.
Per member you get the HA state, grid role and replication state, CPU, memory and swap, and the service checks NIOS keeps itself: DNS, DHCP, NTP, replication, disk, and the hardware of both nodes (power supplies, fans, RAID). A failed check turns the member orange with the check named on the tile, and the detail card lists every check per node. For DNS you see the query rate, the average latency of authoritative and recursive answers over the last minute, and the cache hit ratio; for DHCP the message counters (discover, offer, request, ack, nak) and every subnet with its utilisation.
Alerts
- Critical: a member that stops answering ping.
- Warning: a service check reports failed, an HA pair is broken, or a DHCP subnet is above 90% used.
Servers (Cisco IMC)
Aegis polls the Cisco IMC of a Catalyst Center appliance, or of any standalone UCS C-series server, over SNMP and shows the server on the Wired page under its site. This is the hardware underneath Catalyst Center: Aegis reads the management controller, so it keeps reporting when the operating system on the server is down.
Per server you get the model and Cisco IMC version, the power state and power draw, the inlet and exhaust temperature and the temperature of each processor, and the state of every part you can replace: power supplies, fans, processors, memory modules, the storage controller and its RAID battery, disks and virtual drives. The detail card also lists the faults the Cisco IMC holds itself, with their severity and since when.
Alerts
- Critical: the server answers neither ping nor SNMP, a part is not operable (a power supply, a disk, a memory module), the server is powered off, or the Cisco IMC holds a fault of severity major or critical.
- Warning: a Cisco IMC fault of severity warning or minor, or a server that is reachable but returns no hardware data over SNMP.
Topology
The topology view draws the switching layer per site from CDP and LLDP neighbour data collected during polling, no manual diagram to maintain. Use it to see how access switches hang off the distribution layer, and which uplinks carry a site.
Pick a site from the selector, or open the page filtered straight to one site. Devices that Aegis monitors are drawn with their live status, so a failing uplink is visible in the picture rather than only in a table.
Client lookup
Troubleshoot answers the question a service desk actually gets: "where is this device and why is it slow?". Search by MAC address, IP or hostname and Aegis returns the controller, AP, SSID, band and signal for a wireless client, or the switch and port for a wired one.
Clients you care about can be tracked, so their history stays visible across roaming events instead of being a single point in time.
LoRa gateways
Aegis can monitor LoRaWAN gateways registered in ChirpStack. Once enabled, a LoRa Gateways item appears in the sidebar listing every gateway with its online state and when it was last seen.
-
Go to Admin → Integrations → LoRa
Enter the ChirpStack server ashost:port, the tenant ID and a Network API key. -
Enable and save
A dedicated poller collects gateway state on the configured interval and caches it locally, so the page stays responsive regardless of ChirpStack's own load.
Orb sensors
Orb sensors measure the experience an actual user gets: responsiveness, latency and loss from the edge of the network. Enabling the integration adds an Agents item to the sidebar with the sensors and their measurements.
Sensors push their data to the relay component that ships with the appliance, which forwards it into the same time-series database as the rest of your metrics. Switch the integration on under Admin → Integrations → ORB.
Audit log
Every sign-in, configuration change and administrative action is written to an audit log with a timestamp, the user and the source address. It is visible under Admin → Audit and is the record to reach for when you need to answer who changed what, or where access came from.
What lands there: successful and failed logins, logouts, password changes, two-factor enrolment and resets, device and integration changes, update runs, and, when endpoint ports are protected by the Aegis login, every visit to an endpoint's own page with the address it came from.
Forwarding to a syslog server
The same entries can go to your syslog collector as they happen, so the audit trail also lives outside the appliance. Under Admin → Audit → Syslog forwarding you give the server by hostname or address, the port, UDP or TCP, and the facility, and you choose which results are sent: info (page visits, logouts), ok (successful logins and changes) and fail (failed logins and failed actions), each with its own switch. A test button sends one message and shows you exactly what went out.
Messages follow RFC 5424: the severity follows the result (informational, notice, warning), the appliance name is the hostname, and the user, source address and result travel as structured data, so a collector can filter on them without parsing the text. TCP uses octet-counting framing (RFC 6587). A collector that is unreachable never slows the appliance down; the entry still lands in the local log.
SAML single sign-on
Aegis can hand authentication to your identity provider over SAML 2.0, so people sign in with the account they already have. It works with any SAML 2.0 provider: Microsoft Entra ID, Okta, ADFS and others. Group membership from the identity provider decides whether someone gets the Admin or the Viewer (read-only) role, and no passwords are stored in Aegis.
A local account with MFA (a time-based one-time code) keeps working alongside SSO, and so does LDAP, so you always have a way back in if the identity provider is unreachable.
What to register at your identity provider
Your identity provider needs to know where to send people back to. Replace
aegis.example.com with your own hostname:
| Value | URL |
|---|---|
| Entity ID Audience URI |
https://aegis.example.com/saml/metadata |
| Reply URL Assertion Consumer Service |
https://aegis.example.com/saml/acs |
| Sign-on URL | https://aegis.example.com/saml/login |
| Logout URL optional |
https://aegis.example.com/saml/sls |
Aegis publishes its own metadata at /saml/metadata. Most providers can import that file
directly, which fills in the Entity ID and Reply URL for you. The sign-on and logout URLs are not part
of SAML metadata and always have to be entered by hand.
Configuring Aegis
-
Go to Admin → Integrations → SAML Single Sign-On
The panel shows the URLs above, filled in with your own hostname and ready to copy. -
Import the identity provider metadata
Drop the provider's metadata XML onto the upload area, or paste it. The issuer, sign-on URL, logout URL and signing certificate are filled in automatically. You can also enter them by hand. -
Map groups to roles
Add each group that should have access and choose Admin or Viewer. The value must match exactly what the provider sends, with Entra ID that is normally the group's object ID, not its name. -
Test the configuration
Test configuration checks the settings, the signing certificate and its expiry date locally, without contacting the identity provider. -
Enable SAML login
A Single Sign-On button appears on the login page. Username and password login stays available beside it.
How access is decided
| Situation | Result |
|---|---|
| Member of a group mapped to Admin | Admin: full access, including the admin panel |
| Member of a group mapped to Viewer | Viewer: read-only dashboards and alerts |
| Member of both | Admin, the stronger role wins |
| Member of none of the mapped groups | Access denied, even though the provider authenticated them |
| No groups configured at all | Everyone who authenticates gets the Viewer role |
Attributes
By default the username comes from the NameID in the assertion: usually the user principal name or
email address. To use a different claim, set Username attribute to its name. Groups
are read from the groups attribute. Providers that send full claim URIs, such as Entra ID
and ADFS, are matched on the last part of the URI, so no customisation is needed.
Cisco ACI
MetaWiFi Aegis can connect to a Cisco APIC to pull fabric health, tenant and endpoint data into the dashboard. ACI integration is optional and configured separately from standard SNMP polling.
-
Go to Admin → Integrations → ACI
Enter the APIC hostname or IP address, and the credentials for a read-only monitoring account. -
Test the connection
Use the Test connection button to verify Aegis can reach the APIC. -
Save and enable
Once the connection is confirmed, save the settings. ACI data will appear in the dashboard within a few minutes.
Cisco ISE
Aegis reads the state of a Cisco Identity Services Engine deployment from the Primary Administration Node and shows it on the Identity (ISE) page: every node with its role and whether it is connected, the ISE version and installed patches, the system certificates per node and when they expire, the result of the last configuration backup, and the smart-licensing registration. The same facts feed the alert list, so a node that drops out of the deployment, a certificate that is about to expire or a backup that failed shows up next to your switch and controller alerts.
What you need on ISE
- ISE 3.1 or later, with Open API switched on under Administration → System → Settings → API Settings.
- A dedicated admin account for Aegis in the ERS Operator admin group. Read Only Admin on its own is not enough; ISE answers those requests with a bare 401.
- HTTPS (TCP 443) from the Aegis appliance to the Primary PAN, and to the Secondary PAN if you fill it in.
-
Go to Admin → Cisco ISE Integration
Enter the FQDN of the Primary PAN, optionally the Secondary PAN, and the credentials of the Aegis account. The site label is what the alert list shows as the site of ISE alerts. -
Test the connection
Test connection reports the number of nodes and their roles when the account works, and says whether a failure is the password or the admin group. -
Save and enable
The ISE page and the sidebar entry appear, and the first poll lands within the poll interval (five minutes by default).
Alerts
| Alert | Severity | When |
|---|---|---|
| ISE PAN unreachable | Critical | Neither PAN answers the API |
| ISE node disconnected | Critical | A node reports anything other than Connected |
| ISE certificate expiring | Warning / Critical | A certificate in use expires within 30 days; within 7 days it is critical |
| ISE configuration backup failed | Warning | The last backup did not reach its repository |
| ISE licence not registered | Warning | Smart licensing is not in the registered state |
| ISE data stale | Warning | No successful poll for three intervals |
Cambium Networks
Cambium access points, cnMatrix switches and NSE gateways are usually managed through cnMaestro. With cnMaestro going away, the devices keep working, but the monitoring that came with it does not. Aegis monitors them directly over SNMP, discovers them on the site's subnets, and switches SNMP on over SSH where it is off. Sites without their own appliance work too: with an Edge Monitor Gateway on site, Aegis polls the Cambium equipment through the tunnel. The module has its own switch under Admin, Cambium Networks, its own poller and its own inventory, so it can be turned off or removed without touching anything else.
What you see
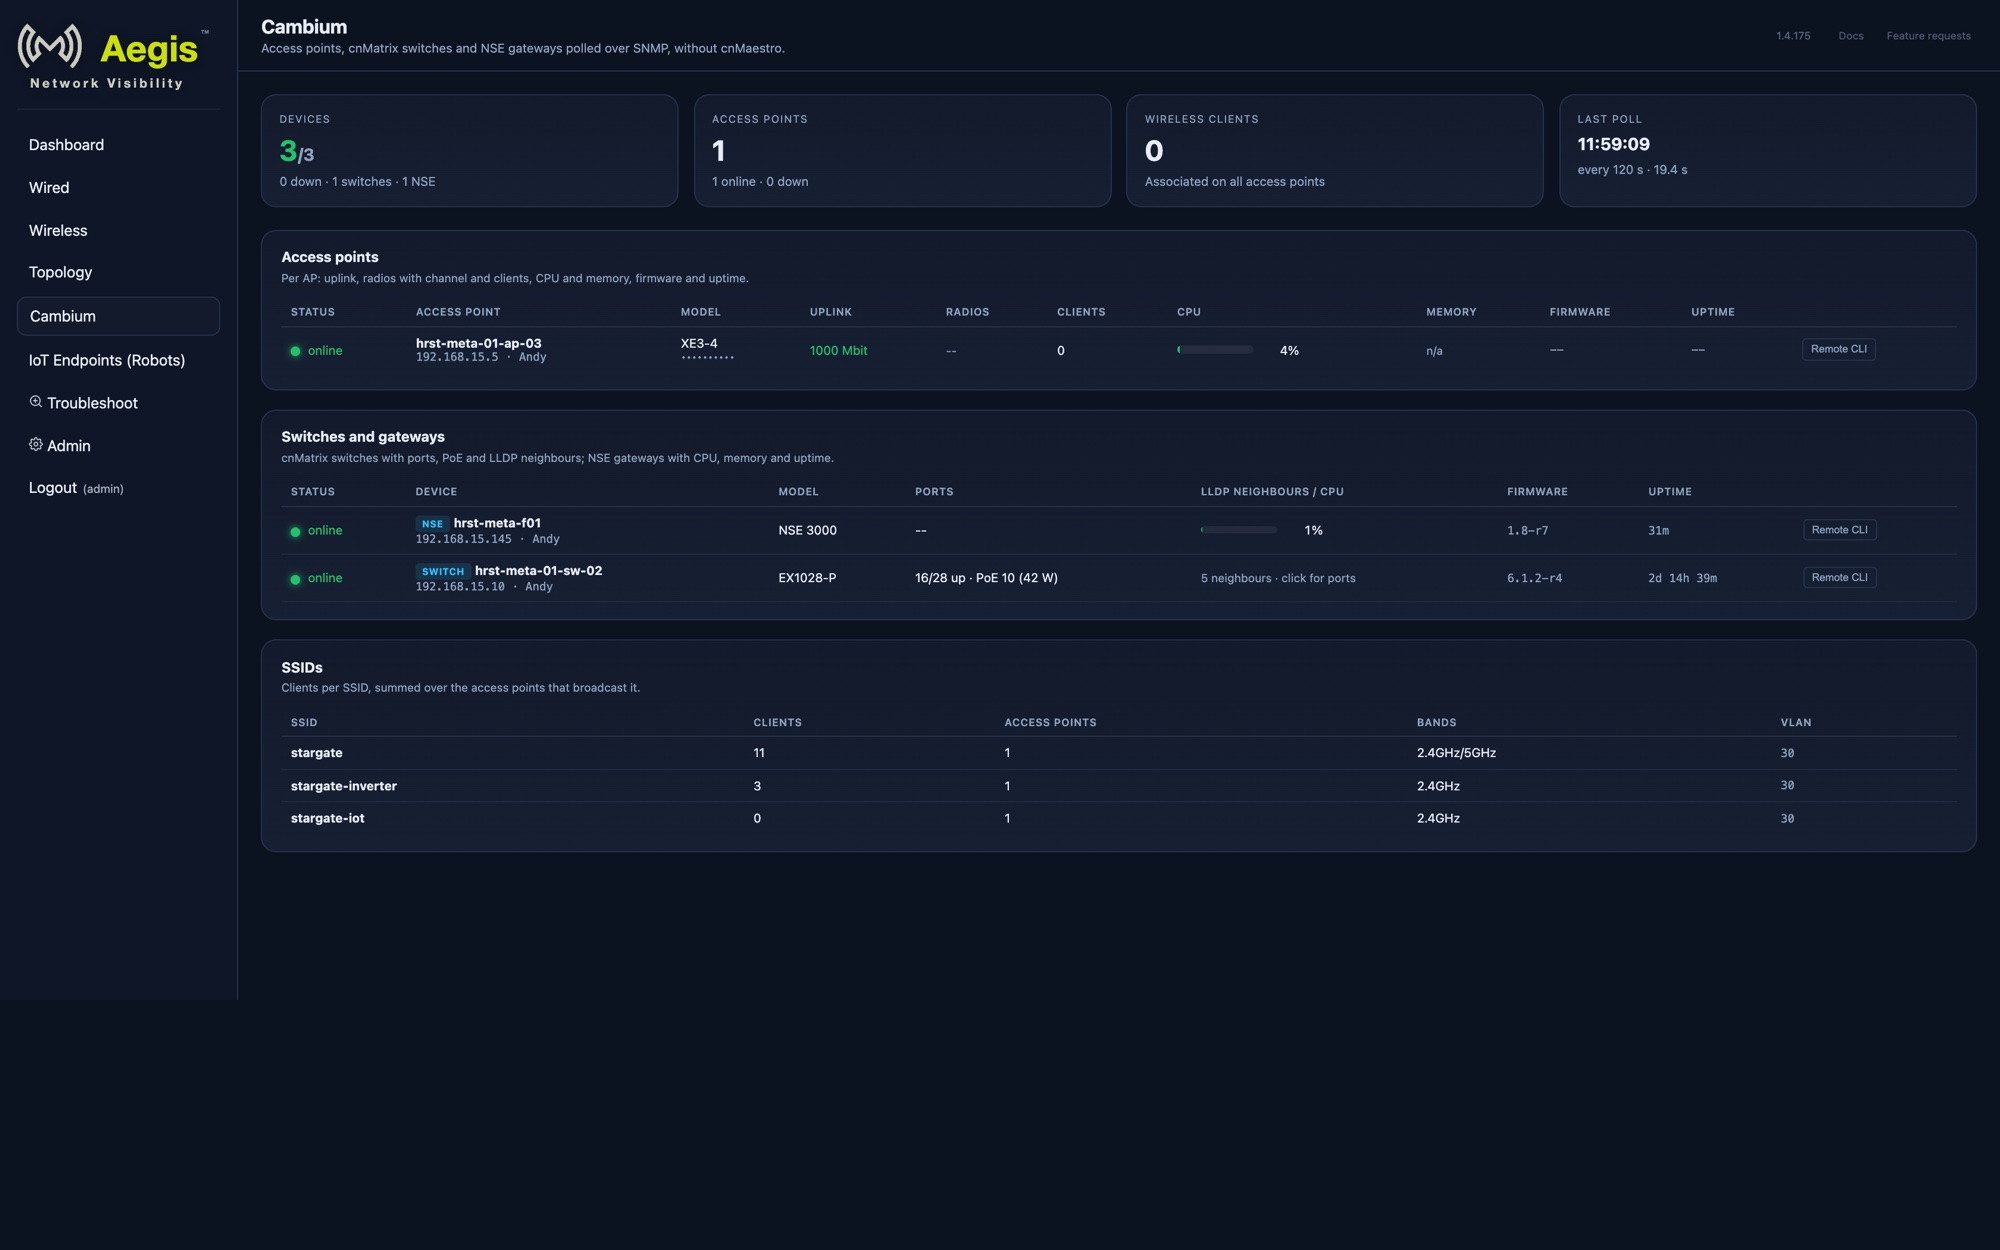
- Access points: online state, model, firmware and uptime, CPU and memory, each radio with band, channel, width, clients, noise floor and airtime, clients per SSID, and the wired uplink with its negotiated speed.
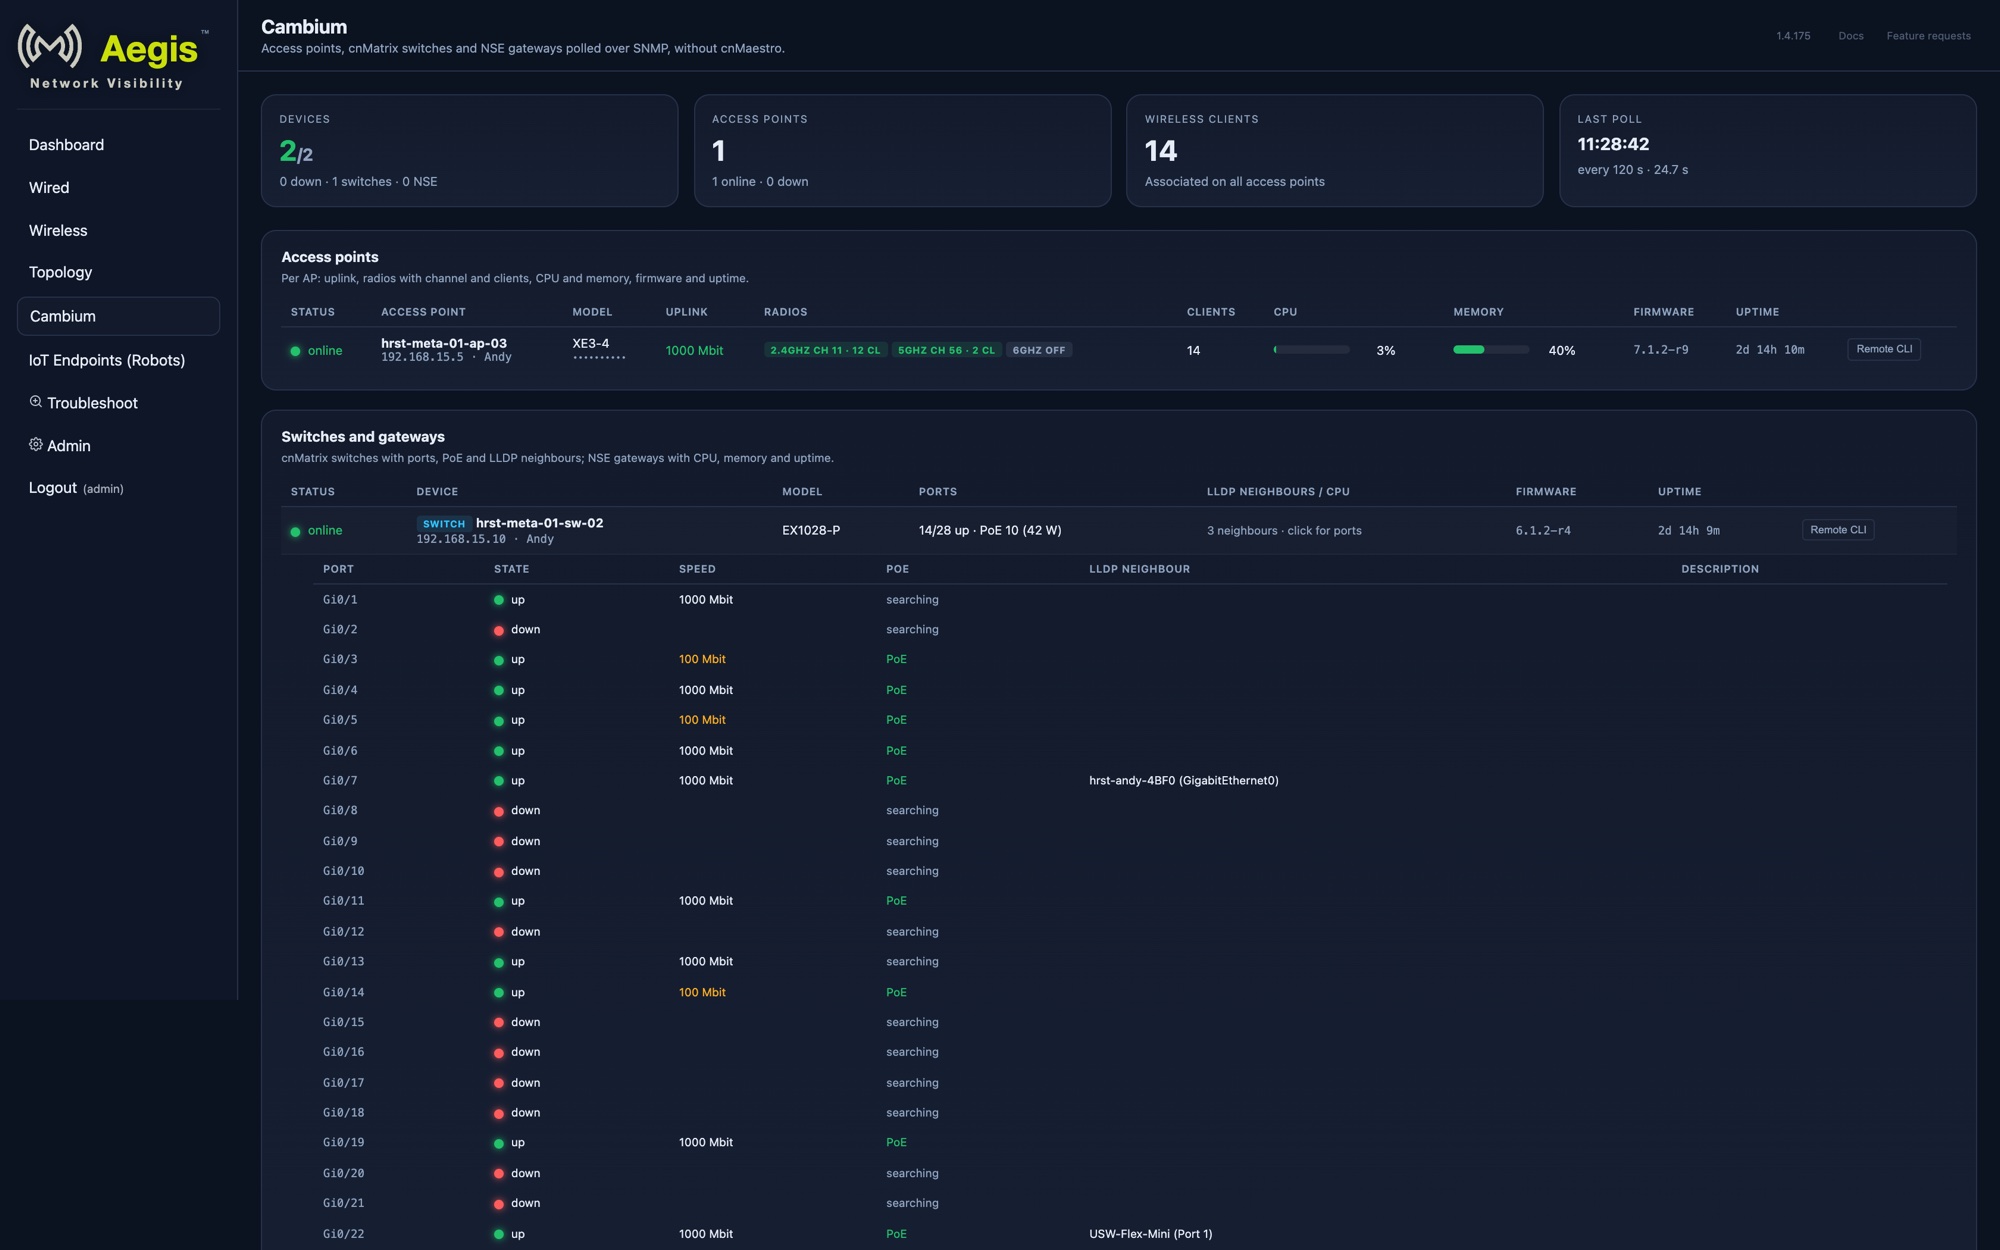
- cnMatrix switches: ports with state and speed, PoE per port and the PoE budget in use, LLDP neighbours (the access point behind every port), firmware and uptime. Click a switch on the Cambium page for its port table.
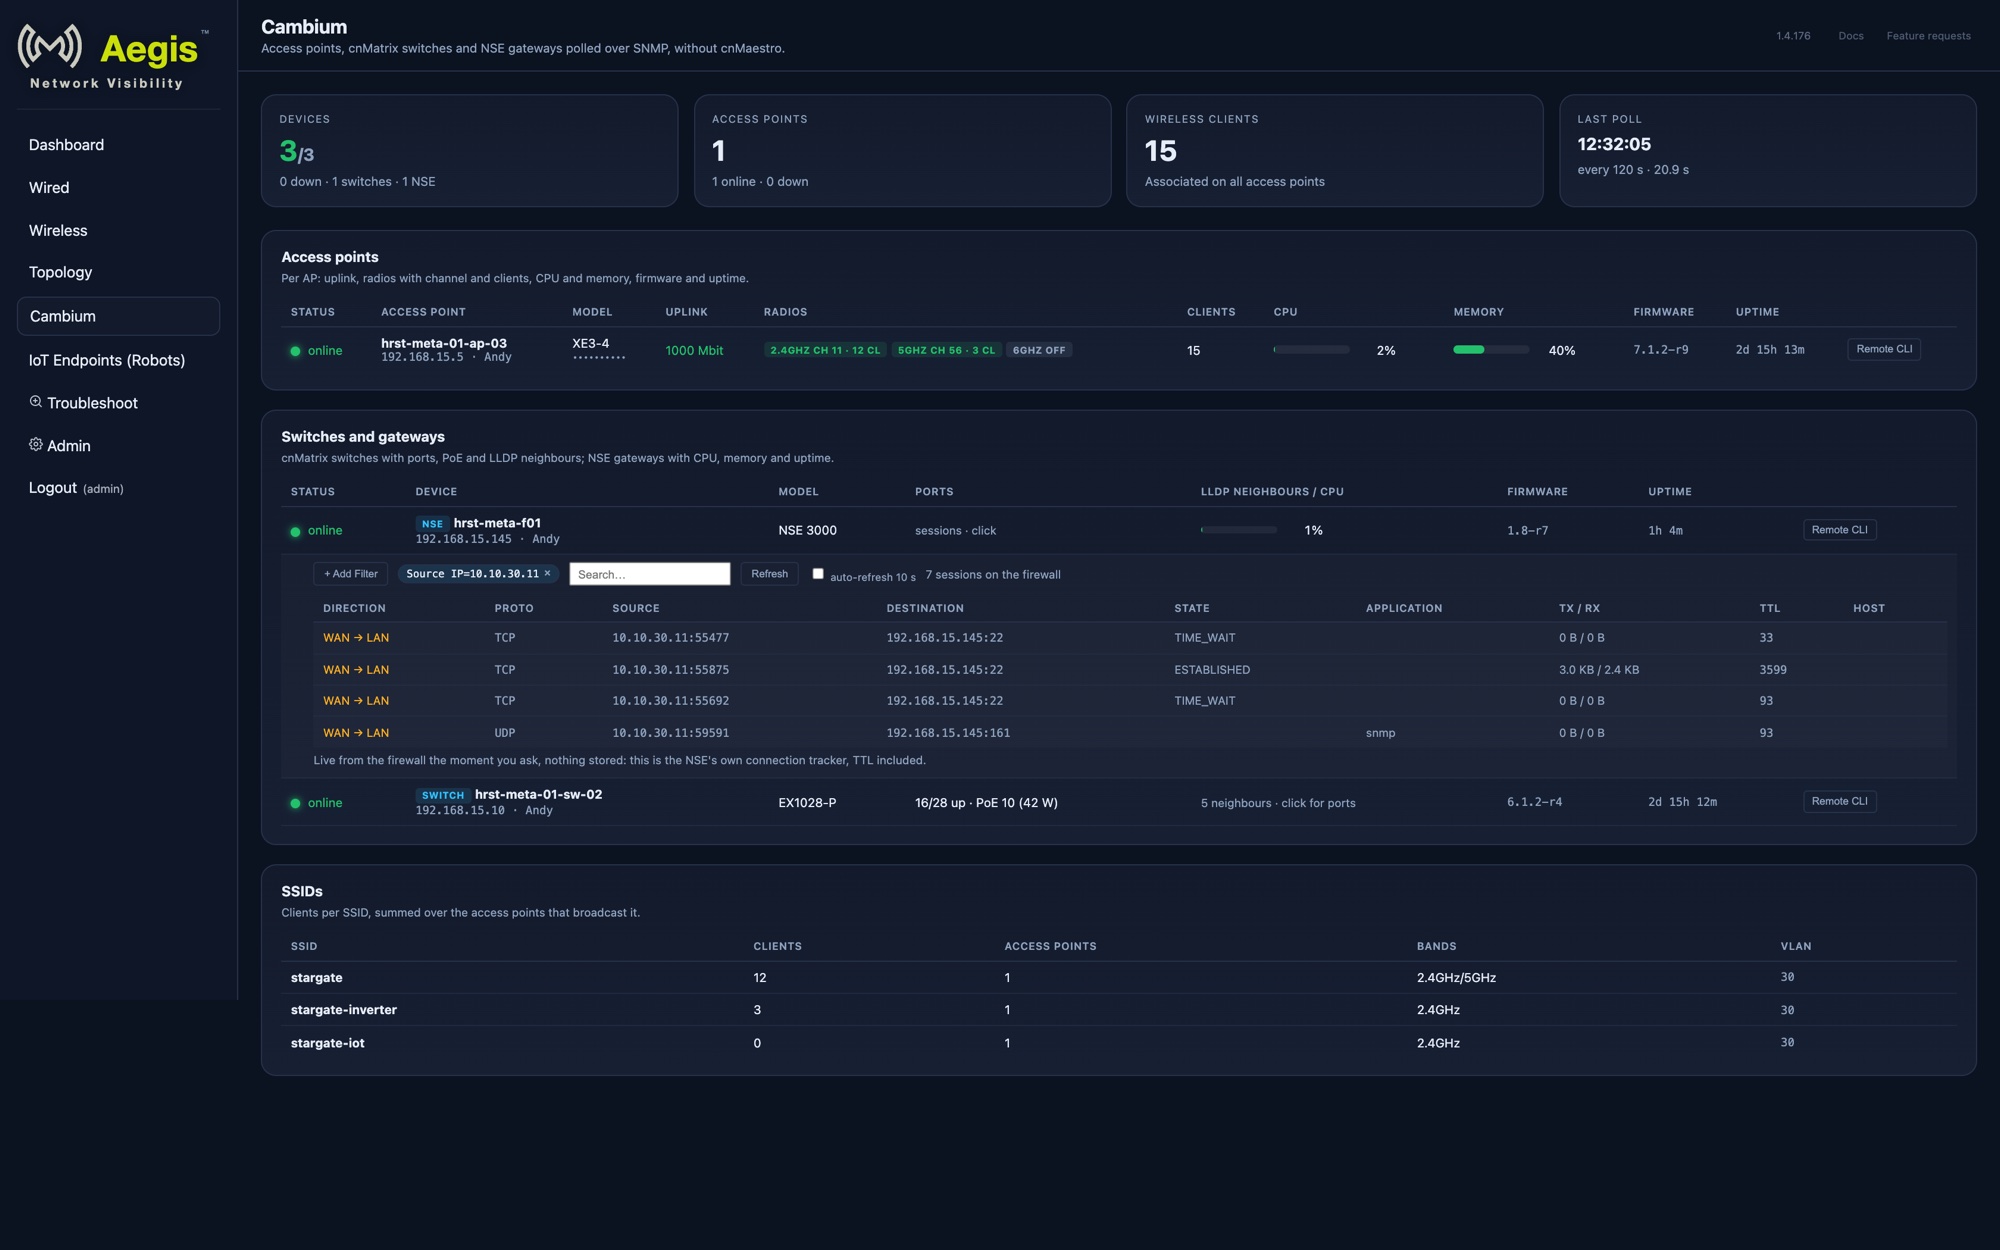
- NSE gateways: CPU, memory, firmware, uptime, reachability, and the live connection
table: click the NSE for every session with source, destination, direction (LAN to WAN or WAN to
LAN), TCP state, application and the firewall's own TTL, read over SSH the moment you ask and never
stored. Filter it the way FortiAnalyzer users do:
Source IP=10.0.0.5 AND Service=tcp/443, comma or AND separated, with auto-refresh for a live view. The table is the connection tracker, so every session in it is allowed traffic. - Sites: with more than one site the page shows a tab per site next to "All sites": one for every Edge Monitor Gateway and one for every site label given to locally discovered devices. Each tab is the whole page for that site: the figures at the top, the access points, the switches and gateways. Devices are placed under the gateway they were onboarded behind, or the one whose site subnet holds their address; local devices without a label sit under "Default local site".
- History: CPU and memory of every access point and NSE gateway are kept per poll. Click a CPU or memory bar on the Cambium page for a chart with a two-hour window that you step through or jump to a day. cnMatrix switches expose no CPU, memory or temperature over SNMP, so they have no history.
- Remote CLI: an admin can open an SSH session to any Cambium device straight from the page, the workflow cnMaestro users know as Remote CLI. Aegis logs in with the account from the Cambium settings for that family (access points, cnMatrix switches and NSE gateways each have their own), so no password leaves the appliance; the browser only carries keystrokes and screen output. Every session is written to the audit log and recorded on the appliance, and it closes after 15 minutes without typing or after an hour.
- Alerts, in the same list as everything else: device offline (critical), device reachable but not answering SNMP, access point uplink at 100 Mbit, switch with a restricted SNMP view, and stale data.
Setting it up
Switching the integration on with an empty inventory starts a short wizard, also available as Add a site. It asks where the equipment is. On the same network as Aegis: you give the subnets to sweep. At a remote site without an Aegis: the site needs an Edge Monitor Gateway first, so the wizard lists your gateways, lets you add one, and waits for its first handshake before it goes on; it can also give the site a shadow prefix when its subnet is used elsewhere. Behind an Aegis RMS router: not for a Cambium site, because an RMS router forwards one machine and never routes the subnet. The steps below are the same form the wizard lands you in.
-
Admin, Cambium Networks
Choose the Site to discover: a site behind an Edge Monitor Gateway brings its own subnets and site name; for a site reached directly, enter its subnets (comma separated) and a site label. Then the SNMP v2c read community Aegis will use on every Cambium device, and optionally the SSH logins Aegis may use to switch SNMP on: the access point user (usuallyadmin) and a cnMatrix user with privilege 15. Save. -
Discover site
A line above the button says which site the next discovery sweeps, and only that site's subnets are swept: discovering one site never reaches into another. A subnet that belongs to an Edge gateway is discovered by choosing that gateway's site. Aegis probes every address in the subnets: a host counts as alive when it answers ping or has SSH open, so discovery also works where ICMP is filtered between VLANs. Each live host is asked for its SNMP identity; Cambium devices are recognised by their enterprise identifier and shown with kind, name and model. Hosts that only have SSH open and no SNMP are almost always access points that still have SNMP off; they are listed with the kind set to "ap (guess)". Change it to nse or switch when you know better. If the guessed kind's account is refused, Enable SNMP tries the NSE and switch accounts too, and sets the device up as whatever accepts the login. Devices behind an Edge gateway inherit that gateway's site; for locally discovered devices the Site column is editable per row, prefilled with the site label. -
Enable SNMP on selected
For the selected devices Aegis logs in over SSH and writes the read community, then saves. What it sends is listed below, so you can do the same by hand. Run Discover again afterwards: the devices now answer SNMP and are identified. -
Onboard selected
Adds the devices to the Cambium inventory. They show up on the Cambium page at once, marked first poll running, and the poller polls them within seconds instead of waiting for its next round. The full round runs every five minutes, counted from the start of one round to the next.
Accounts and SNMP per site. The SNMP community and the access point, cnMatrix and NSE accounts below Site to discover are global: the directly reachable site uses them, and every Edge gateway site inherits them. Choose an Edge gateway's site and untick Inherit from global to give that site its own community and accounts; a field left empty still inherits the global value. Enable SNMP, Test SNMP, the Remote CLI, the NSE session table and the poller all use the accounts of the site a device belongs to, so two customers on one appliance can each keep their own passwords.
With more than one site the list of onboarded devices is grouped per site, each with its number of access points, switches and NSE gateways. When an access point turns up at another address (DHCP), Aegis looks for it by name in the subnets of its own site only.
Onboarded first, SNMP later
The order above is not mandatory. A device can be onboarded while its SNMP is still off or restricted; it then shows up on the Cambium page as offline (access points) or with SNMP view restricted (a cnMatrix that only exposes its system group, the factory state). Nothing is lost: run Discover again, select the device, and press Enable SNMP on selected; or give the device the same read community another way, for example through the SNMPv2c RO community of its cnMaestro switch group. The poller picks the device up on its next round and the warning clears by itself, no re-onboarding needed. A site with its own accounts uses its own community here too.
Not sure why a device stays silent? Put its address in Test SNMP on and press Test. When SNMP does not answer, the result explains what the appliance can see: the route it takes to the address (local, or into a tunnel when an Edge gateway's subnet overlaps it), whether an Edge gateway claims the address, and whether ping and SSH answer.
What provisioning does, per device type
Every Cambium device family has its own CLI. These are the exact commands Aegis sends; use them yourself over SSH, on the console, or through the cnMaestro Remote CLI while that still exists.
Access point (XV and XE). Setting the community alone is not enough: the agent
stays off until the bare snmp-server command is given.
snmp-server read-community <community>
snmp-server
save
cnMatrix switch. Out of the box a cnMatrix answers the community public
with the system group only (name, uptime, version): the built-in view called restricted. Ports,
LLDP and PoE need the full view. The switch already carries a read-only group with that view; the
community only has to be bound to its security name. This needs privilege 15, so log in with such an
account or use enable first.
configure terminal
snmp community index aegis name <community> security cambiumReadOnlyV2 nonvolatile
end
write startup-config
NSE 3000 / 4000. Enable SNMP covers the NSE too, with the NSE account from the
settings. The NSE keeps a change pending until apply; save only writes it to
flash, so without apply the community is in the configuration while the agent stays silent. The running
agent also keeps its old community until it is restarted, so Aegis switches it off and on, each step
applied, and then saves. No NSE account configured? Run it by hand over SSH:
snmp-server read-community <community>
apply
no snmp-server
apply
snmp-server
apply
save
A device that keeps a different community (an NSE that already answers public, for instance)
can be onboarded with its own community; the inventory stores one per device.
When cnMaestro is still in the picture
- cnMaestro can report a device as in sync while the SNMP settings from its profile never reached
the device's own configuration. Check with
show configon the device; thesnmp-server read-communityline must be there. - A sync can fail on a single item (a user's privilege level, for example) and leave the device not in sync. Do not force a full sync on a core switch to fix SNMP: set the community locally with the commands above instead. Local CLI settings stay in place whatever cnMaestro does, and they are all that remains once cnMaestro is gone.
- The cnMaestro Remote CLI accepts the commands above, so SNMP can be switched on without direct access to the device.
Reachability
From the appliance (or from the Edge Monitor Gateway's tunnel) to the Cambium devices: ICMP for the sweep, SNMP on UDP 161 for polling, and SSH on TCP 22 while provisioning and during a shell session. An NSE that also acts as the site firewall must allow SNMP on the interface Aegis reaches it on, and its own filter rules apply to the source address the polls arrive from.
Aegis Remote Management System
Aegis RMS gives the dashboard a secure path to equipment that has no fixed line: machines, AGVs and other IoT endpoints reached over a 4G router on site. The routers dial your appliance directly over an encrypted WireGuard tunnel: no hub in between, nothing hosted by anyone else, one hop from the site to the dashboard. Aegis monitors the routers next to your switches, and opens each endpoint's own web page through the dashboard. Typical setup: a Teltonika RUT241 per docking station, with one or more endpoints behind it.
How it fits together
The appliance is the tunnel server. Each router connects outbound to it on one UDP port (51820 by default), which also works behind 4G carrier-grade NAT, because the router always dials out. On premises you forward that one port on your firewall to the appliance; an instance on a VPS or cloud server already has a public address. Aegis then reaches the endpoints over the tunnel and publishes each one on a local port (18100-18199), so an operator never needs VPN software of their own, they browse the dashboard and click Open. The routers themselves appear on the Wired page with CPU, memory, temperature and LTE signal, including history. Routers never see each other through the appliance.
What the router needs
Aegis generates one block per router that you paste on it once (over SSH, or in the CLI of the router's web interface). It is worth knowing what that block puts in place, because it tells you what "configured" means when you check a site:
- A WireGuard keypair made on the router itself: the private key never leaves the device; only its public key is pasted back into Aegis. A preshared key generated by Aegis is the second factor on the tunnel.
- A tunnel interface to the appliance: with the tunnel address Aegis assigned to that router.
- A management address on the tunnel interface, used to reach the equipment behind the router without exposing the router's own interface.
- A forward to the equipment: so that address lands on the machine's web interface rather than on the router.
- Access rules that let the appliance in over the tunnel and nothing else.
- A key for the appliance: so Aegis can read status and move the local Wi-Fi link between machines.
- The endpoint definitions: which machine, which SSID, which credentials.
The tunnel and firewall part is the generated block; the endpoint definitions and the appliance's SSH key are the remaining steps, described in the onboarding notes. We can do the whole setup for you at our hourly rate.
Configuration
-
Go to Admin → Integrations → AEGIS RMS, Step 1
Enable the tunnel server, click Generate keypair and fill in the public address the routers dial (the appliance's public DNS name or IP). On premises, forward UDP 51820 on your firewall to the appliance. Save & test reports that the tunnel server is up. -
Add a router
Name and site are enough: Aegis assigns the tunnel address and the address its web interface is published on, and makes the router's preshared key. -
Setup: paste the block on the router
Open Setup for the router and copy the block. Paste it on the Teltonika as root, over SSH or in the CLI of its web interface. It creates the tunnel and firewall rules and prints the router's public key when it runs. -
Paste the public key back
Save it in the same panel. The router becomes a peer of the running tunnel at once; the panel and the router's row turn green on the first handshake. Test from here pings the router through the tunnel. -
Add the SSH key for router management, then the endpoints
Paste the private key Aegis uses to read the routers' status and to move the Wi-Fi link between endpoints. A router block made after the key is saved authorises its public half on that router; for a router set up earlier, add the line by hand (step 4 of a fresh block shows it). It is stored encrypted, never shown again. Then add each endpoint under its router; every endpoint is assigned a port automatically.
Access control
The endpoint ports can be placed behind the Aegis login, which is strongly recommended whenever the appliance is reachable from the internet: enable Require the Aegis login on the endpoint ports. Visitors without a session are redirected to the dashboard login, and every visit is written to the audit log with its source address: useful input for a firewall allowlist. Without this option the ports are raw passthrough and only the endpoint's own login protects it.
For customers who use Aegis purely for this purpose, IoT endpoints only hides the network pages (Dashboard, Wired, Wireless, Topology, Troubleshoot) and leaves just the endpoint view.
198.18.0.0/15.
Edge Monitor Gateway
Where Aegis RMS reaches individual machines behind a router, an Edge Monitor Gateway brings a whole remote location into the dashboard. Place a Teltonika router at the site (or another router that speaks WireGuard, see Another WireGuard router), let it dial your appliance, and Aegis monitors the gateway itself (CPU, memory, uptime, LTE signal where applicable) as a device of that site, and can poll the network equipment behind it. It is the building block for sites without their own appliance, and it works just as well as an add-on to an on-prem install that needs eyes on a branch location.
How it connects
The gateway dials out to the appliance over an encrypted WireGuard tunnel and keeps that tunnel alive. Nothing needs to be opened inbound at the site: 4G with carrier-grade NAT, a wired WAN port on the site's own network, or a guest uplink all work, as long as outbound UDP to the appliance is allowed. On the appliance side one UDP port is forwarded (on premises) or already public (Aegis Cloud). Keys follow a strict flow: the keypair is generated on the router and the private key never leaves it; only the public key is pasted into Aegis, and a preshared key made by Aegis rides along as a second factor. The tunnel carries exactly the gateway and the site subnets you listed, nothing else.
Configuration
-
Enable the tunnel server once
Under Admin → Integrations → AEGIS RMS, Step 1: keypair, public address, and on premises the UDP port forwarded to the appliance. Shared by RMS routers and Edge gateways. -
Go to Admin → Integrations → Edge Monitor Gateway
Add the gateway: a name, the site it belongs to, and the site subnets you want to monitor behind it. Its tunnel address is assigned for you. -
Paste the router block
The Setup panel generates a complete configuration block for the router. Log in on the router asroot: connect a laptop to its LAN port and runssh [email protected], or open the CLI in its web interface. The password is the one printed on the router's label, unless it has been changed. Paste the whole block: it creates the tunnel, the firewall rules and the masquerade that lets polled devices answer, adds the management key Aegis logs in with to read the router's CPU, memory and LTE signal, and prints the router's public key when it runs. -
Paste the public key back
Save it in the same panel: the gateway becomes a peer at once and turns green on the first handshake. Test from here pings the gateway and the first address of each site subnet. The gateway appears on the Wired page within one poll cycle.
Gateway in the site's own network
Often the gateway is not the router of the site but a device in its network: its LAN cable goes into a
port of the site's own switch or firewall. Fill in LAN address for the gateway: a free
address in the site subnet, for example 192.168.15.250. The block then also gives the router
that address, without a gateway, and switches off its DHCP server and IPv6 router advertisements, so it
never hands out addresses in the customer's network. Without it a Teltonika keeps its factory LAN
(192.168.1.1, with DHCP on) and cannot reach the site.
Another WireGuard router
The Teltonika route is the supported one: Aegis writes the configuration for it and reads the gateway's own health. Any other router that speaks WireGuard can be an Edge gateway too. Add the gateway with Router: Other WireGuard router. Setup then shows no block to paste but the values to enter in the router's own WireGuard settings, and the same as a WireGuard config in the common wg-quick format.
| On the router | What to set |
|---|---|
| Keypair | Generated on the router. Its public key is pasted back in Aegis, the private key stays on the router. |
| Tunnel interface | The tunnel address Aegis assigned to this gateway. |
| Peer | The appliance: its public key, the preshared key, its public address and UDP port as endpoint, allowed IPs only the appliance's tunnel address, keepalive 25 seconds. |
| Firewall | Accept traffic from the appliance's tunnel address to the router itself, ping included, and forward it to the site subnets. Nothing else in from the tunnel. |
| NAT | Masquerade (source NAT) traffic from the appliance towards the site, so the equipment answers the router. Or route the tunnel network back to the router on the site's own gateway. |
Two sites with the same subnet (shadow prefix)
Branch sites often come with the same private network: site A and site B both run 192.168.1.0/24. One appliance cannot route the same subnet to two gateways, so Aegis gives such a site a shadow prefix. Switch Shadow on in the gateway's row: the appliance takes a prefix of the same size from its shadow pool (10.95.0.0/16 by default, one /24 per site subnet, the pool is a setting in Step 1), the tunnel carries that prefix instead of the real one, and the router maps it one-to-one onto the site with a NAT rule (NETMAP; on a router without that module the block installs one rule per address). Aegis polls, pings, discovers and opens shells on the shadow addresses, so nothing overlaps on the appliance. The pages show the address the site uses, with the shadow address next to it: "192.168.1.10 via 10.95.1.10". This is an Edge Monitor Gateway feature only; Aegis RMS routers and the takeover of a robot's web interface are unchanged.
-
Turn Shadow on for the gateway
Admin → Integrations → Edge Monitor Gateway, column Shadow. The row shows the mapping at once (192.168.1.0/24 → 10.95.1.0/24). Paste the router block from Setup again: it now carries the NAT rules, and the peer's tunnel prefix has already changed. -
Add the site's devices behind that gateway
Cambium: under Admin → Cambium Networks choose the gateway's site in Site to discover; the sweep runs on the shadow prefix and onboarded devices keep their site and real address. Cisco switches: in Add Switch(es) choose the gateway under Behind an Edge Monitor Gateway and type the addresses as the site uses them; Aegis scans and stores them on the shadow prefix. -
Nothing else changes
Polling, history, alerts, the web terminal and the DHCP follow-up of access points all work on the shadow address. A site that was already onboarded moves along by itself: when you switch Shadow on (or off), every Cambium device and switch of that site is moved to its new address and keeps its name, site and real address. The page tells you how many moved, and the audit log lists them.
SIGNL4 alerting
SIGNL4 is a mobile alerting and on-call scheduling platform. Aegis can escalate alerts to SIGNL4 for mobile notification, acknowledgement tracking and escalation workflows.
-
Create a SIGNL4 team
Sign up at signl4.com and create a team. Copy your team's webhook URL from the SIGNL4 portal. -
Go to Admin → Integrations → SIGNL4
Paste the webhook URL, then set your daytime window and timezone. Which devices escalate, and when, is controlled per device with tags: see Alert escalation below. -
Add an API key (optional)
The webhook only sends. With an API key, created in SIGNL4 under Integrations → Api Keys and pasted under the webhook, Aegis also reads back what on-call did with each alert: open, acknowledged or closed, by whom and when. The key is only used to read, is stored encrypted and is never shown again; alerts keep going out through the webhook. Test API key tells you whether SIGNL4 accepts it and how many teams it can read. See What on-call did with an alert for what it shows. -
Test the integration
To stop alerts for a while, use Pause alert routing instead of switching the integration off or changing the webhook: nothing is sent until you resume, test alerts keep working, and alerts that were already sent are still closed when they clear. The panel and the dashboard show that routing is paused.
Use the Send test alert button to verify delivery to your SIGNL4 team. The answer shows what SIGNL4 replied, with its event id. This test carries no team name; to test a route that depends on one, use the Test button of a tag (see below).
For detailed control over which alerts are escalated, see Alert escalation.
Alert escalation
Aegis does not escalate every alert, it applies escalation logic before sending anything to SIGNL4. This keeps your on-call team focused on actionable incidents and prevents alert fatigue.
Severity levels
Every condition Aegis detects is classified by severity. All severities are always visible on the dashboard; only some are eligible to escalate to your on-call team via SIGNL4.
| Severity | Meaning | Can escalate to SIGNL4? |
|---|---|---|
| Critical | Service impact or device failure: requires immediate attention | Yes: while the device's tag window is active |
| Warning | Degraded state or threshold exceeded: monitor closely | Only when the tag enables Warnings; they follow the tag's own Warnings window |
| Info | Informational events and state changes | No: dashboard only |
On top of severity, every condition is either an alert or an insight (see Alerts, Insights and Closed). An insight never escalates and is never mailed, even when it is a Warning on a tag that escalates Warnings: a busy radio or an AP on a 100 Mbps uplink is planning, not a page.
Per-device escalation & tags
Escalation to SIGNL4 is opt-in per device. A device with no tag is still fully monitored on the dashboard, but never escalates to on-call. To enable escalation, group devices with a tag (Admin → Integrations → SIGNL4 → Tags) and give the tag an alert window that decides when its Critical alerts escalate.
| Alert window | Criticals escalate | Warnings can be enabled? |
|---|---|---|
| Always | 24/7 | - |
| Daytime only | During office hours: the daytime window (default 08:00-17:00) on the office days (default Monday to Friday) | Yes: during daytime |
| Out of hours only | Outside office hours, including all of a day that is not an office day | - |
| Custom window | Inside a time range you define (e.g. 17:00-22:00; may span midnight) | Yes: inside the range |
| Never | Never | - |
A per-tag “Also escalate Warnings” toggle additionally escalates Warning-level alerts. They follow
the tag's Warnings window: by default the same window as the tag, but it can be stricter.
A distribution switch or firewall whose outage must alert to SIGNL4 around the clock can keep its Warnings to
Daytime only, so a lost power-supply redundancy waits for office hours while an outage still wakes
someone. Criticals always follow the tag window, untouched by both settings. A tag can also carry a
team / filter keyword so different device groups reach the right SIGNL4 responders.
SIGNL4 can route on keywords in an alert's title and text, so Aegis puts the team name in both:
Campus: [SITE] Switch offline. Use the word your SIGNL4 distribution rule or category
keyword looks for; a tag with two names, such as Datacenter, Campus, matches both rules.
One team outside office hours. Office hours are the daytime window on the office days
you tick (Monday to Friday by default). Fill in the Standby routing tag, for example
Consignatie: the keyword for the handoff to standby. Outside office hours every escalated
alert carries that tag in its Subteam field instead of its tag's team name, so the workflow
of your standby team in SIGNL4 matches it and the daytime teams do not: one alert, one team.
Which alerts escalate at night is still decided by the alert window of each tag. In SIGNL4, filter a
workflow on the parameter Subteam, with Contains and the team name.
Who has standby duty
SIGNL4 keeps the duty roster; Aegis can show it. With the API key set, choose the On-call team in SIGNL4 under Admin → SIGNL4: the team that covers the hours outside office hours. The dashboard's On-Call card then says who has duty in that team right now, and its tooltip lists who takes over during the week, with stand-ins named. It is read from SIGNL4 once an hour. Aegis only reads: the roster stays in SIGNL4, and nothing of it is stored on the appliance. Without a team chosen, the line is not shown.
The Test button of a tag sends a test alert the way a Critical in that tag travels: with the
tag's team name, over the tag's own webhook when it has one, and also outside the tag's alert window.
A tag that also escalates Warnings has a second button, Test warning: the same test with
Severity set to Warning, to check a SIGNL4 workflow that filters on that parameter.
SIGNL4 accepts every event it receives; one that matches none of its rules is listed nowhere. If the
test is listed and nobody is notified, nobody is on duty for that team.
If a Warning that was already sent later escalates to Critical, Aegis re-escalates so the incident is never
understated.
Devices without an alert tag are pointed out. Below the tags, the SIGNL4 panel lists every device that raises alerts but matches no tag, with an Add to tag choice per device, and the panel header counts them while it is closed. The dashboard's on-call card says how many devices don't have an alert tag, and an alert from such a device carries a No alert tag marker. A device in a tag set to Never counts as a deliberate choice and is not listed. Switches, wireless controllers, firewalls, load balancers, Infoblox, Cisco ISE, servers, Cambium devices and the RMS and Edge gateways can all be tagged.
Alert payload
Every alert escalated to SIGNL4 includes:
- Site: the site name where the alert originated
- Device: hostname or IP address of the affected device
- Alert type: category of the alert (e.g. CPU high, uplink down, AP offline)
- Severity: Critical, Warning or Info
- Timestamp: when the alert was first detected
- Description: human-readable explanation of what triggered the alert
Auto-resolve
When the condition that triggered an alert clears, Aegis automatically sends a resolve signal to SIGNL4. The corresponding incident in SIGNL4 is closed without manual intervention.
A warning goes to SIGNL4 once per occurrence. If it is still open when its window closes in the evening, nothing happens: it is not resolved and it does not go out again the next morning. It is resolved when the problem clears. A restart or update of the appliance does not send open warnings again either. A critical on a daytime tag keeps its window behaviour: closed at the end of the window, sent again when the window opens and the problem is still there.
What the SIGNL4 API key adds
The webhook is one-way: Aegis tells SIGNL4 that an alert was raised, and later that it cleared. What the on-call engineer did in between happens on their phone, in the SIGNL4 app, and Aegis did not know. With an API key (see SIGNL4 alerting) Aegis reads that back every couple of minutes, for every alert it sent: open, acknowledged or closed, by whom and when. Alerts still go out through the webhook; the key is only used to read.
That shows in three places:
- The On-Call Alerts card on the dashboard. Red when something is open in SIGNL4 and nobody has picked it up, orange when everything open is acknowledged, green when nothing is open. It also says how many alerts on-call closed while the problem is still present in Aegis, so those do not count as on-call but are not forgotten either.
- The active alert list. An acknowledged alert is greyed out on the Alerts tab with a small Acked badge and the engineer's name. A closed alert moves to the Closed tab and leaves the Active Alerts count. Both stay until the condition clears in Aegis.
- The alert history. Each acknowledgement and close is recorded once, at the time it happened in SIGNL4 and with the name, so the history of an alert reads raised, acknowledged, closed, cleared. Kept for 90 days.
The life of an alert
Seen from the engineer on duty, with a SIGNL4 API key in place:
- Aegis detects a change. A distribution switch stops answering. Within a poll the alert Switch offline appears on the Alerts tab, Critical, with its start time, and the Active Alerts card counts it. The switch's dependent alerts are suppressed.
- The tag decides whether on-call hears about it. The switch is in a tag with window Always, so the alert goes to SIGNL4 at once, with the tag's team name in the title. At night the standby routing tag is used instead, so the standby team gets it and the day teams do not. An untagged device, a device in maintenance or an insight never gets this far.
- SIGNL4 alerts, the engineer acknowledges. The engineer takes the alert in the SIGNL4 app. A couple of minutes later Aegis shows it greyed out with Acked and their name, the On-Call Alerts card turns from red to orange, and the history gets an acknowledged line. Colleagues looking at the dashboard see that someone is on it.
- The engineer closes it in SIGNL4. Say the switch has to wait for a site visit in the morning. The engineer closes the Signl. In Aegis the alert moves to the Closed tab, the Active Alerts count drops, the On-Call card no longer counts it, and the history gets a closed line. The condition itself is still visible on the Closed tab and on the switch's tile. Aegis does not page again for it.
- The condition clears. The switch comes back. Aegis sends a resolve to SIGNL4, so an alert that was still open there is closed without anyone touching it. In Aegis the alert lingers a couple of minutes and disappears; the history records cleared with the total duration.
A Warning follows the same path, but only on a tag that escalates Warnings and only inside that tag's Warnings window. If it is still open when the window closes in the evening, nothing happens: it does not alert to SIGNL4 again the next morning. A Warning that becomes Critical is sent again, so an incident is never understated. If on-call closed an alert in SIGNL4 and the same problem comes back later as a new alert, that is a new Signl.
Maintenance suppression
Alerts from devices or sites that are in a planned maintenance window are automatically suppressed, they will not be escalated to SIGNL4 for the duration of the window. This prevents false on-call notifications during scheduled work.
Availability reporting
The Reporting page (administrators only) shows per device an availability score up to 100% over the previous month, the last 30 or the last 7 days, with an average per category — switches, wireless controllers, firewalls, load balancers and Cisco ISE — and one overall figure. Devices are ordered lowest score first, so what needs attention is at the top. Cambium devices have their own category while the Cambium integration is switched on; with the integration off they are not in the report.
How the figure is measured
Availability comes from the appliance's own outage records: every detected loss of reachability with its start and end. Time inside a registered maintenance window does not count against a device, and the report lists which windows were excluded, with their label and duration. When the appliance has not been measuring for the full period, the report says from which date it measures instead of counting the unmeasured days as perfect. Records are kept for 90 days.
Custom reports and PDF
Custom report lets you pick sites and filter device names; the averages and the overall score follow your selection, and a badge marks the report as a custom selection. Print / PDF expands every table and prints through a clean light layout with the logo, the period and the generation time, so your browser's save-as-PDF produces a document you can hand to an auditor.
Emailed on a schedule
At the bottom of the page you set who receives the report and how often: monthly on a day of the month or weekly, from an hour you choose, to its own list of recipients. The mail is a short covering note with the period, the number of devices and the overall figure. The report itself is attached as a PDF, with the score per category and per device, the excluded maintenance windows and the generation time. Send now delivers it immediately so you can check the result.
Port usage report
The Port usage tab on the Reporting page (administrators only) answers one question: which switch ports have not been used for a long time. Ports that stay empty for a year are hardware and licences you may not need, and a stack member on which every port is unused can often be taken out.
How use is measured
A switch cannot answer this itself over a long period, because its traffic counters and its "last input" start again at zero with every reboot. Aegis therefore keeps its own record. With every poll it notes per port whether the link is up and whether the traffic counters went up since the previous poll. The second check also catches a device that was plugged in and out between two polls. When a switch reports a shorter uptime than before, it has rebooted: that poll only sets new starting values and does not count as traffic.
The record starts on the day the appliance runs version 1.4.210 or later, but it does not start empty. When Aegis first sees a switch it asks, once, what the switch itself remembers about its ports that are down: a port whose counters are still zero has carried nothing since the switch last restarted, and the switch knows when a port went down. The observation of such a port then starts at that moment, so a port that has been dark for a year shows as unused right away, with the number of days. Each switch is also filled in once with the days on which the appliance still holds traffic for a port from before that day. Uplinks and the other ports of the network module (such as Te1/1/1), port channels, VLAN interfaces and the management port are left out, and so is a port the switch has not reported for two weeks, such as a stack member that was removed. The port list of a switch says how many ports were not counted.
Reading the report
| Result | Meaning |
|---|---|
| In use | Used at least once inside the period you chose. |
| Unused | Not used inside the period, and observed for at least as long. |
| Too early to say | No use seen, but observed for less than the period. The report shows since when the port is measured. |
Choose the period at the top. The report opens on 3 months; 6, 12, 24 and 36 months or your own number are one choice away. The cards show the totals, including the switches and stack members on which every access port is unused. The chart shows how many access ports were in use per month, over the whole time the record covers. In the table, select a switch to see its ports with the date each was last used.
One switch, several, or everything
Choose sites or switches narrows the report to one or more sites, or to switches you search for and select. Download CSV gives one line per port for the selection, and Print / PDF prints it through the same clean layout as the availability report.
Leaving a port out
Some ports are free on purpose: a spare, or a port reserved for an emergency. In the port list of a switch, Leave out takes such a port out of the report and asks for an optional reason. The port is then listed as Excluded with that reason and counts nowhere: not in the totals, not for its stack member and not in the chart. Count again brings it back. The ports you left out are kept with the settings, so they are in the configuration backup, and each change is written to the audit log.
A whole switch can be left out the same way, for example a lab switch or one that is being phased out. Open the switch in the table and choose Leave this switch out. The switch stays in the list, marked as left out with your reason, and counts in no total. Count again on its row brings it back.
Planned maintenance
Scheduled maintenance windows tell Aegis that a device or site is intentionally offline or being worked on. During a maintenance window, alerts are suppressed and the affected device or site is visually marked on the main dashboard so operators know the degraded state is expected.
Maintenance scope
| Scope | Effect |
|---|---|
| Site level | All devices within the site are put into maintenance. The site tile on the main page shows a maintenance badge. No alerts are escalated for any device in that site. |
| Device level | Only the selected device is put into maintenance. Other devices in the same site continue to alert normally. The device is marked in the site detail view. |
| ISE node | On the Identity (ISE) page every node has the same maintenance button. While the window runs, that node's alerts (disconnected, certificate expiring) are suppressed; the node keeps being polled and the other nodes alert normally. |
Scheduling a maintenance window
-
Navigate to the site or device
From the main dashboard, click a site tile to open the site detail view. To schedule maintenance for a specific device, click the device within the site. -
Open the maintenance panel
Click the Maintenance button in the site or device header. -
Set the duration
Choose a preset duration (30 min, 1 hour, 2 hours, 4 hours, 8 hours) or set a custom start and end time. Maintenance windows can span multiple days for extended work. -
Add an optional note
A short description of the planned work: visible to other operators on the dashboard. -
Confirm
The window is activated immediately or at the scheduled start time.
Main dashboard display
The main dashboard always shows the current maintenance state at a glance:
- Active maintenance: sites and devices currently in a maintenance window are shown with a maintenance badge. Their health score is greyed out and alerts are suppressed.
- Planned maintenance: upcoming windows scheduled for the next 24 hours are listed in the maintenance overview panel on the main page, so the team knows what is coming.
Ending maintenance early
If the work finishes before the window expires, maintenance can be ended manually. Navigate back to the site or device and click End maintenance. Normal polling and alert escalation resume immediately.
Updates
MetaWiFi Aegis checks for updates automatically. When a new version is available, an Update available button appears at the top right of every page, next to the version you run.
-
Click Update available
The window shows the version you run, the latest release and its date, and how far behind you are. -
Click Apply Update
Aegis triggers the update process in the background. Services restart automatically once the update is complete. This typically takes 2-5 minutes. -
Verify
After the update completes the dashboard reloads and shows the new version number.
When an appliance falls behind
Once an hour the appliance compares the version it runs with the latest release. When it is a number of versions behind, the update button turns orange and says so, for example 12 versions behind, and the alert recipients under Admin → Settings → Email / SMTP get a mail. That mail comes again once a week for as long as the appliance stays behind. The number is set under Admin → Settings → Updates (5 by default; 0 turns the reminder off).
Automatic updates
Under Admin → Settings → Updates an appliance can install a new release by itself in a maintenance window. Off by default.
| Setting | What it does |
|---|---|
| Days | The days the window opens, for example Saturday and Sunday. |
| From / Until | The time range, in the timezone you set. It may run past midnight, for example 23:00 until 01:00. |
| Only releases out for at least | How many days a release must have been published before it is installed automatically. One day by default, so a release is not installed the night it comes out. |
The automatic update goes the same way as the button: the same update process, the same few minutes, and monitoring picks up where it left off. It tries a release once per window. Afterwards the alert recipients get a mail saying the update was installed, or that it did not complete, in which case the next window tries again and the button works as always.
Operating system updates and the reboot
The appliance keeps its own operating system patched. The admin panel shows how many updates are pending and, after a kernel or library update, that a reboot is required to finish it. An admin can do that reboot from the banner: Reboot appliance… asks twice, a plain confirmation and the word REBOOT typed out, and only works while the host really reports that a reboot is needed. The appliance is away for two to five minutes; every container comes back on its own, the page reconnects when it does, and the request is written to the audit log.
Backup & restore
Aegis stores everything locally: configuration, collected telemetry, license state and integration settings. There is no external cloud dependency. Backups are your responsibility and should be scheduled regularly.
What is stored
| Data | Contents |
|---|---|
| Configuration | Admin credentials, polling targets, SNMP settings, HTTPS certificates, integration settings |
| Telemetry | All collected metrics and time-series data: site health history, device counters, alert history |
| License | Activated license key and validation state |
| Users | Dashboard user accounts and group assignments |
Backup via the dashboard
The easiest way to back up your Aegis instance is directly from the admin panel, no SSH or command-line access required.
-
Go to Admin → Backup
This section shows the current backup status, the last successful backup timestamp, and available restore points. -
Create a backup
Click Create backup now. Aegis creates a snapshot of all configuration, user accounts, license state and integration settings. The backup is stored locally on the server and listed with a date and size. -
Download the backup
Click Download next to a backup entry to save the.tar.gzarchive to your local machine. Store it on a NAS, network share or cloud storage for offsite retention. -
Schedule automatic backups
Enable Scheduled backups under Admin → Backup → Schedule. Choose a daily or weekly interval and optionally set a retention period (e.g. keep the last 7 backups). Aegis handles the rest automatically.
Storage location (advanced)
All Aegis data is stored under a single directory on the server:
/opt/metawifi-aegis/
This applies to all deployments. Backing up this directory is sufficient for a full recovery. For scripted or infrastructure-level backups, this is the path to target.
VM snapshot (OVA deployments)
For virtual machine deployments, a hypervisor-level snapshot captures the full disk state including the OS, services and all data. This is the most complete form of backup for OVA installs.
- VMware / vSphere: right-click the VM → Snapshots → Take Snapshot. Schedule via vSphere Data Protection or your backup solution.
- Proxmox: use the Backup tab on the VM → Backup Now, or configure a scheduled backup job under Datacenter → Backup.
CLI backup
You can back up the data directory directly from the command line. Stop Aegis services first to ensure data consistency.
sudo systemctl stop metawifi
sudo tar -czf aegis-backup-$(date +%Y%m%d).tar.gz /opt/metawifi-aegis
sudo systemctl start metawifi
Copy the resulting .tar.gz file to a remote location (NAS, S3, SFTP, etc.).
To automate this with a cron job, add the following to sudo crontab -e:
0 2 * * * systemctl stop metawifi && tar -czf /var/backups/aegis/aegis-$(date +\%Y\%m\%d).tar.gz /opt/metawifi-aegis && systemctl start metawifi && find /var/backups/aegis -name "aegis-*.tar.gz" -mtime +7 -delete
This runs every night at 02:00, keeps the last 7 daily backups and removes older archives automatically.
Create the backup directory first: sudo mkdir -p /var/backups/aegis
Restore
To restore from a backup taken via the dashboard, go to Admin → Backup on a running Aegis instance,
click Restore and upload the .tar.gz file. Aegis will apply the backup and restart automatically.
To restore from a CLI or VM-level backup to a fresh installation:
-
Deploy a fresh Aegis instance
Deploy a fresh Aegis instance via OVA. Do not complete the setup wizard yet. -
Stop services
sudo systemctl stop metawifi
-
Restore the data directory
sudo rm -rf /opt/metawifi-aegis
sudo tar -xzf aegis-backup-YYYYMMDD.tar.gz -C /
-
Start services
sudo systemctl start metawifi
The dashboard is available at the server's IP address with all data and settings restored.
Security hardening
Aegis ships with a set of security defaults that cover the most common hardening requirements, including NIS2-aligned controls for network monitoring infrastructure. This section explains what is enforced automatically and what you can configure.
Published ports
A port scan of the appliance sees only what is needed: 22 (SSH to the host), 80 and 443 (the dashboard, 80 only redirects to HTTPS) and 57500 (the telemetry receiver). The database and the telemetry pipeline listen on localhost only. The optional ports follow their feature: the Aegis RMS passthrough (18100–18199/tcp and 51820/udp) is published only while Aegis RMS is switched on, and the Orb ingest (8095/tcp) only while the Orb integration is on. Switching a feature off closes its ports again.
A second layer on the host makes this hold whatever a container publishes: a firewall rule set in Docker's own DOCKER-USER chain lets traffic from outside reach only those ports and drops the rest, with a rate-limited line in the kernel log. It is applied at boot and every five minutes, follows the feature switches, and ships in the OVA; existing appliances get it with the update.
HTTPS & TLS
Aegis serves its dashboard over HTTP by default. Enable HTTPS under Admin → HTTPS to terminate TLS at the built-in nginx reverse proxy.
| Setting | Where to configure | Notes |
|---|---|---|
| Enable HTTPS | Admin → HTTPS → Enable | Requires a certificate. Self-signed, uploaded, or Let's Encrypt. |
| Redirect HTTP → HTTPS | Admin → HTTPS → Redirect HTTP | Returns 301 for all plain-HTTP requests once enabled. |
| Let's Encrypt certificate | Admin → HTTPS → Let's Encrypt | Port 80 must be reachable from the internet. Auto-renewal runs via certbot. |
| Self-signed certificate | Admin → HTTPS → Self-signed | Good for internal use. Browsers will show a warning. |
| Upload your own certificate | Admin → HTTPS → Upload | Accepts PEM-encoded cert + key files. |
Strict-Transport-Security (HSTS) header with a 1-year max-age to all responses.
This instructs browsers to only connect over HTTPS going forward.
Session cookies
Aegis uses a server-side session cookie to maintain login state. The cookie security attributes adapt automatically to whether HTTPS is active.
| Attribute | Value | Effect |
|---|---|---|
HttpOnly |
Always on | Prevents JavaScript from reading the session cookie: blocks XSS-based session theft. |
SameSite=Lax |
Always on | Blocks cross-site request forgery (CSRF) on navigation requests. |
Secure |
When HTTPS is active | Set only on HTTPS connections so the cookie is never sent over plain HTTP. Aegis detects the actual request scheme at runtime: toggling HTTPS on or off via Admin takes effect immediately without a restart. |
Content Security Policy
All Aegis responses include a Content-Security-Policy header that restricts
what resources the browser is allowed to load.
| Directive | Allowed sources |
|---|---|
default-src | 'self' |
script-src | 'self' 'unsafe-inline' + jsDelivr CDN |
style-src | 'self' 'unsafe-inline' + Google Fonts + jsDelivr CDN |
connect-src | 'self' + WebSocket (ws: / wss:) |
img-src | 'self' data: blob: |
object-src | 'none': plugins blocked entirely |
frame-ancestors | 'none': embedding blocked (also enforced by X-Frame-Options: DENY) |
connect-src 'self' directive covers the same origin as the page.
If you see a CSP violation for an API call to http:// while the page is on
https://, this is a mixed-content issue: the request is leaving via HTTP
while the page is HTTPS. Enable HTTP → HTTPS redirect in
Admin → HTTPS to ensure all traffic uses HTTPS consistently.
Additional security headers
| Header | Value |
|---|---|
X-Frame-Options | DENY |
X-Content-Type-Options | nosniff |
Referrer-Policy | strict-origin-when-cross-origin |
Strict-Transport-Security | max-age=31536000; includeSubDomains (HTTPS only) |
Rate limiting
The login endpoint is rate-limited to 5 attempts per minute per IP address. After exceeding the limit, further login attempts are rejected with HTTP 429 until the window resets. This applies to both local and LDAP authentication.
Keeping the appliance patched
An administrator can install the host's operating-system updates from Admin → Configuration and, when one is needed, start the reboot from the same panel. Neither needs a shell on the appliance. Both ask for a confirmation word first and both land in the audit log with the account and the address that started them.
The application container does not run the package manager and does not reach into the host. It writes a request that a small root-side service on the host picks up, which ignores anything older than three minutes. The update never reboots by itself; that stays a deliberate step someone plans.
Audit trail off the appliance
Under Admin → Audit the audit log can be forwarded to your own syslog server as RFC 5424 messages, over UDP or TCP, with a switch per result so you can send everything or only the failures. A test button shows the exact message that goes out. Keeping a copy on a system the appliance cannot reach back into is what makes the trail useful after an incident.
Independent code review
The codebase is put through an external security scanner and the findings are tracked. Anything rated critical or high is fixed before the release goes out; what is left carries a written reason. The first login on a new appliance forces the shipped password to be replaced, and the build refuses to produce an image where that step is missing.
NIS2 alignment
Aegis includes a number of controls that support NIS2 compliance for network monitoring infrastructure:
- Audit logging: all logins, configuration changes and device management actions are logged with timestamp, user, IP, action and result. Accessible under Admin → Audit.
- Role-based access control: Admin and Viewer roles limit who can change configuration versus who can only view dashboards.
- LDAP / Active Directory integration: centrally managed identities, group-based access and no local password sprawl.
- HTTPS encryption in transit: all dashboard traffic can be encrypted end-to-end with TLS.
- Encrypted configuration backups: scheduled backups can be AES-encrypted with a password before being written to the backup directory.
- Patch management: pending operating-system updates are shown in the panel and can be installed from it, with the reboot as a separate, deliberate step.
- Audit trail to your SIEM: the audit log can be forwarded to a syslog server as RFC 5424 messages, so a copy lives outside the appliance.
- Minimal exposure: no SSH inbound to Aegis required, no cloud dependency, no telemetry sent externally.