VMware · vSphere · Proxmox
Download as .OVA
Pre-built virtual appliance, import and run in minutes.
Requirements
SizingSmall / Medium / Large →
30-day free trial. Get a PRO license →
Deep visibility into every site and every device from a single pane of glass, wired and wireless, and remote control of the IoT equipment behind them with Aegis RMS.
No credit card required · Free key included · Cancel anytime
 Cisco
Cisco
 Fortinet
 F5
F5
 Cambium cnMatrix · XV · NSE

Configuring is the job; waiting is the problem. Aegis boots from an OVA, scans a subnet and pushes the telemetry config to the switches itself, so the estate is on screen the same day. The next site is a scan away rather than a project.
Native streaming telemetry from your network, a capability most monitoring platforms still don't offer. No extra collectors, no add-ons.
Discover a subnet, pick the switches, and Aegis pushes the telemetry subscriptions for you. Adding a site is a scan, not a change project.
Keep your focus on the network. Aegis decides what matters and how to present it, so you never have to design layouts or think about UX.
Curious where these choices come from? Why Aegis exists →
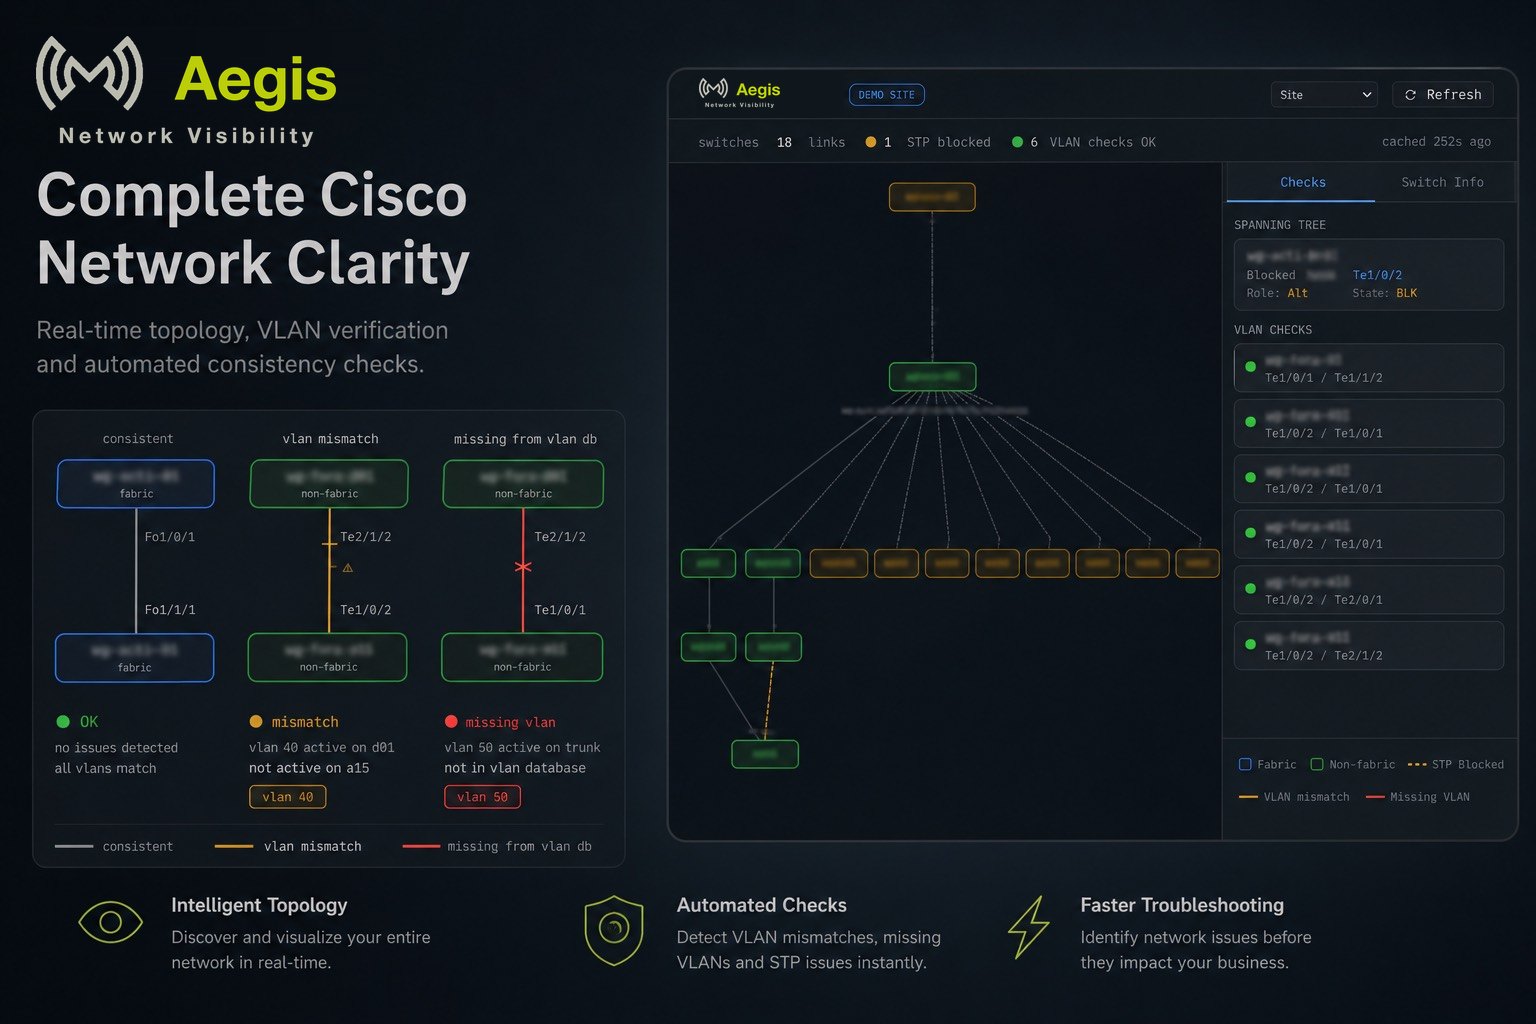
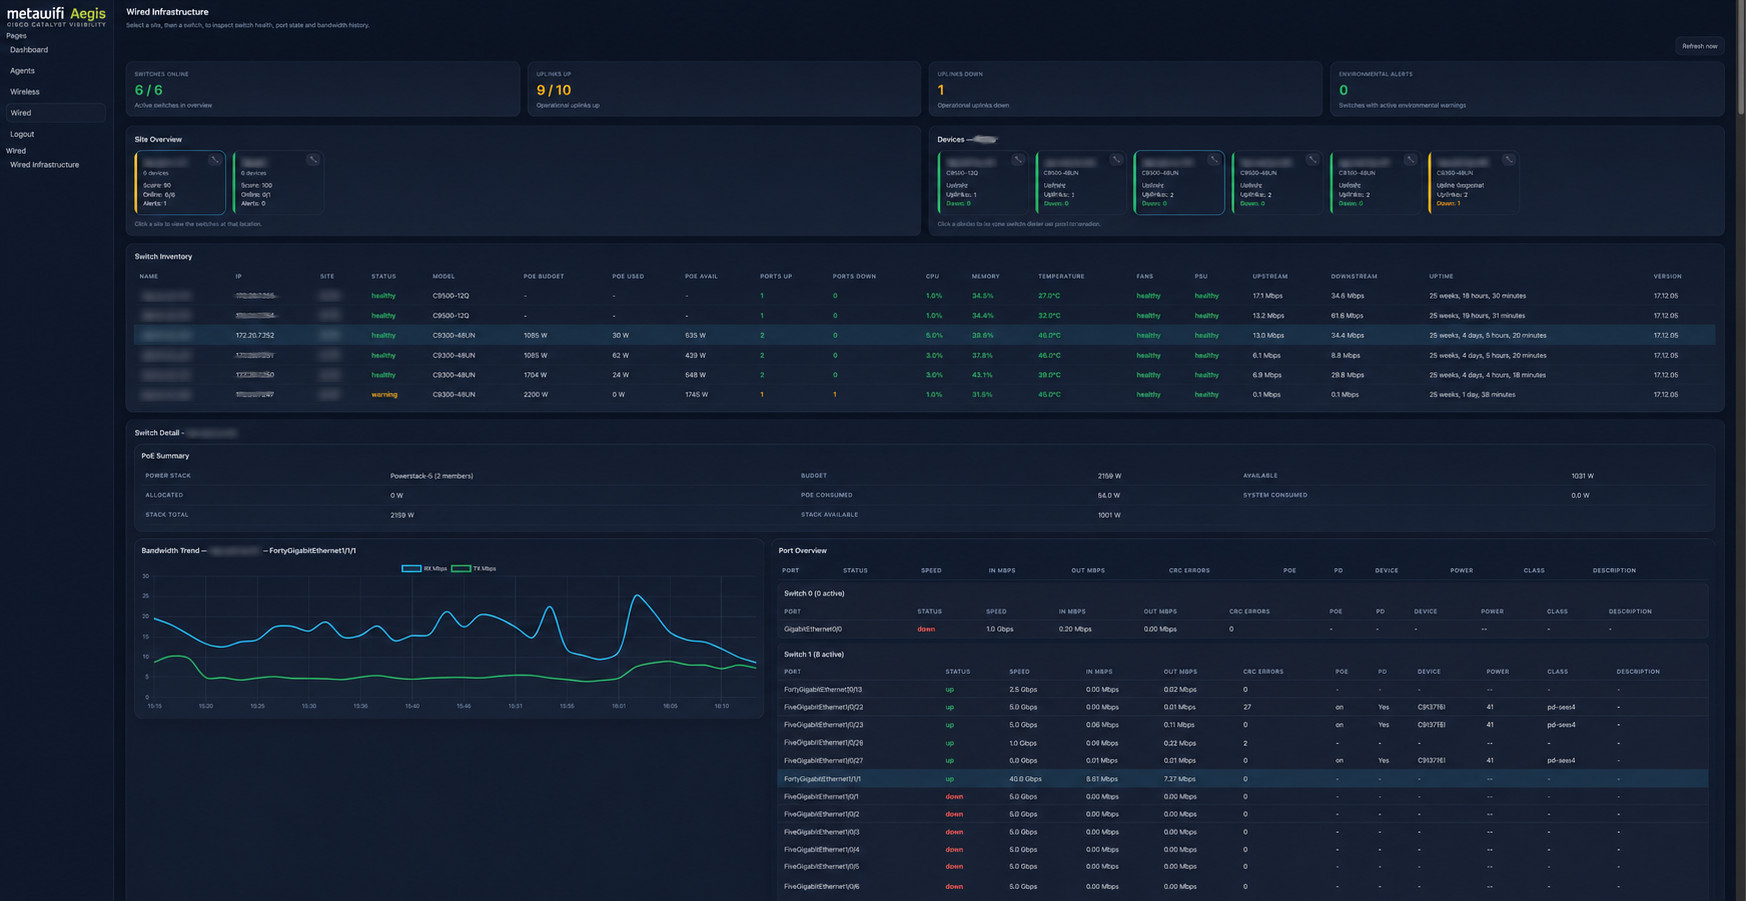
Built for network operations, not generic server monitoring. Wired and wireless are combined into one operational view, and events are correlated so you see service impact instead of isolated telemetry.
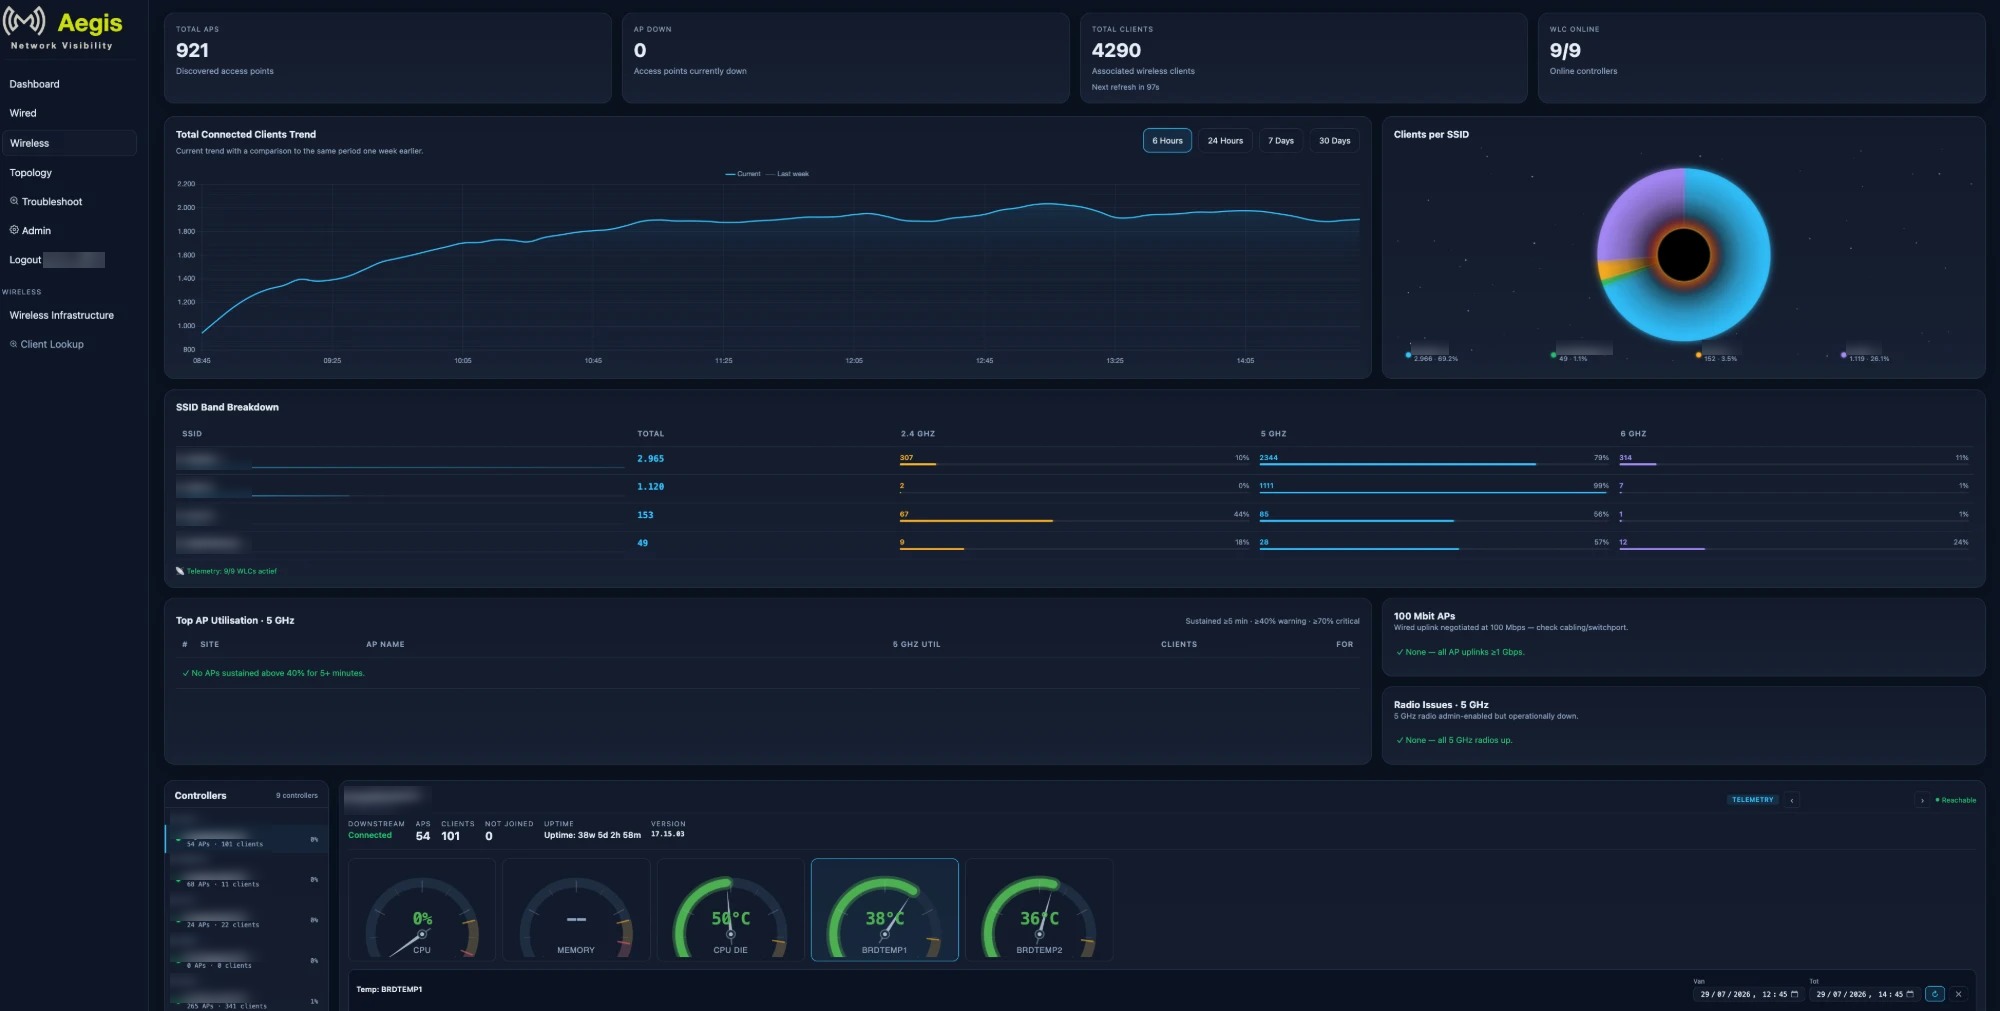
The wireless page: every controller and access point, the client trend against last week, clients per SSID and per band, the busiest radios, access points on a 100 Mbit uplink and radios that are down.
Aegis reads the Cisco ISE deployment from the Primary PAN and keeps an eye on the things that stop 802.1X and guest access without any switch or controller going red.
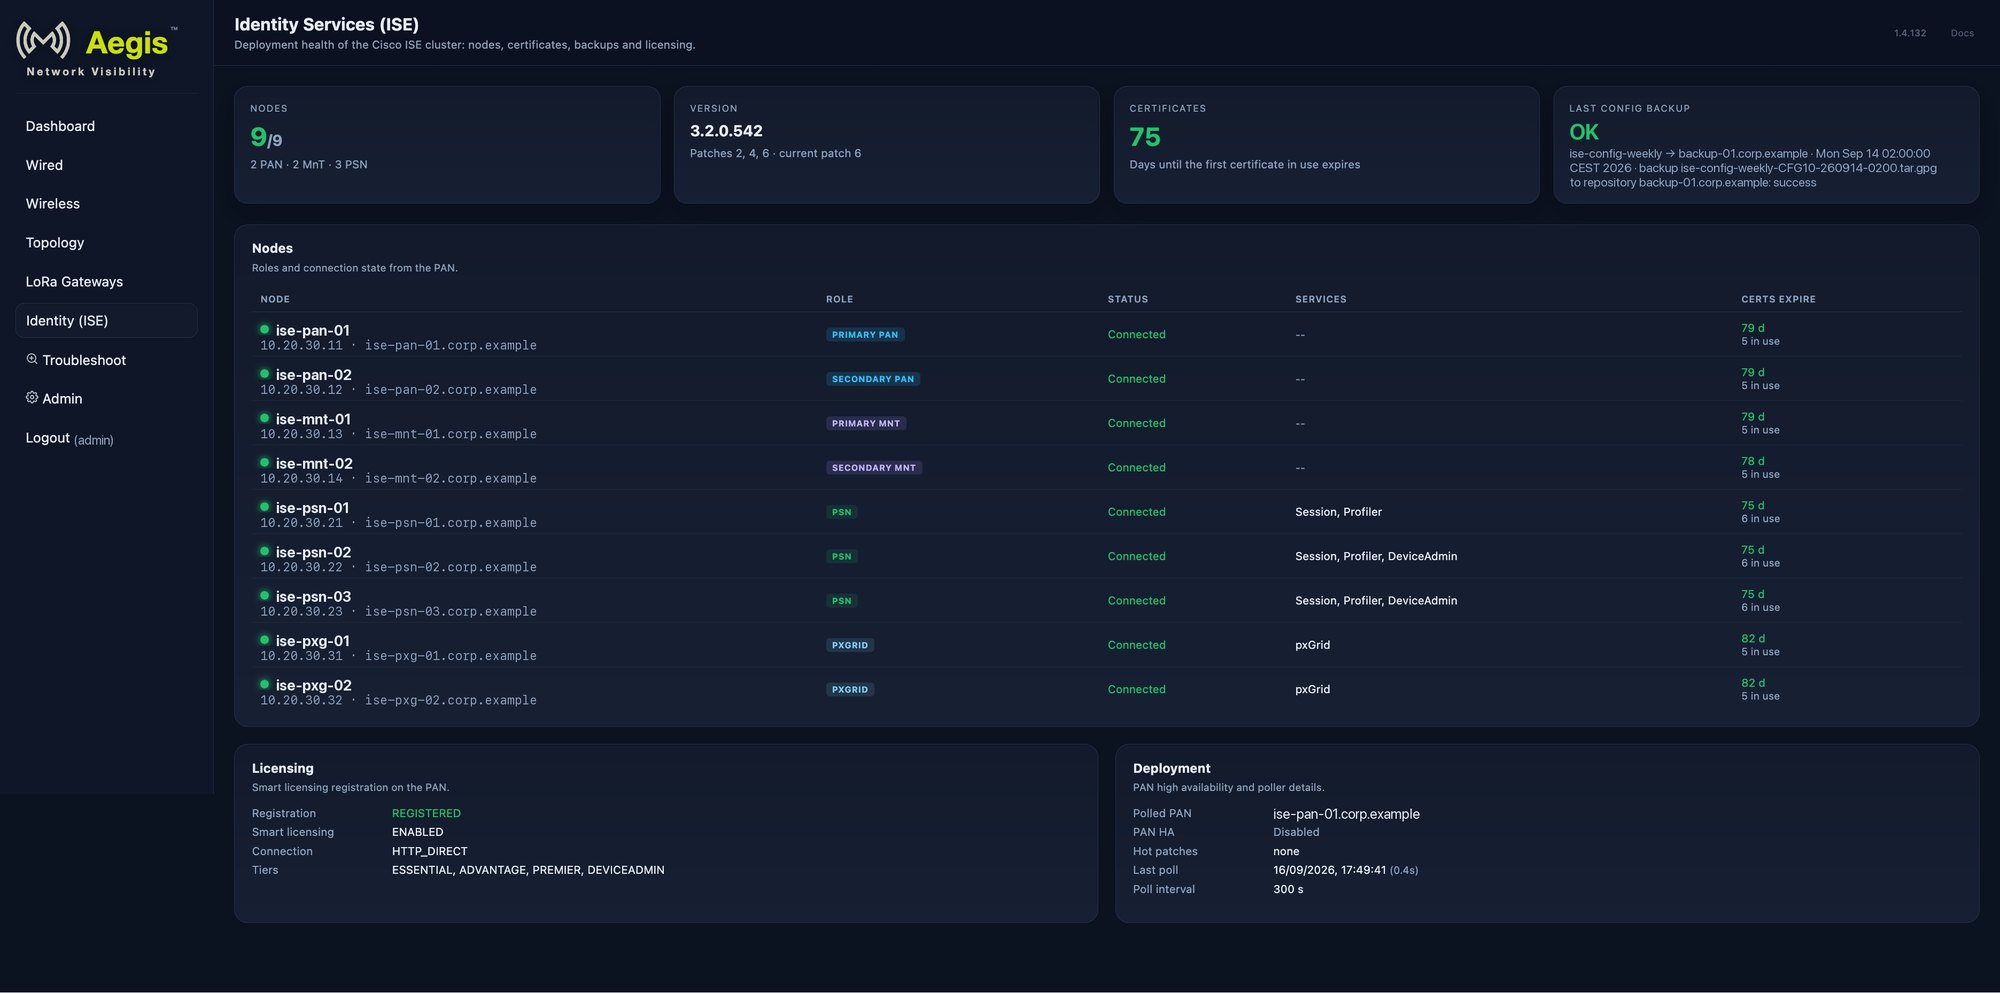
The screenshots on this site come from a running appliance, not a sandbox.

Aegis decides when an incident matters and where to route it. SIGNL4 makes sure the right people are notified, with mobile alerts, on-call scheduling and escalation.
No alert noise: only incidents that impact your network operations.
Your people sign in with the account they already have: Microsoft Entra ID, Okta, ADFS or any SAML 2.0 provider. Aegis stores no passwords.
A local account with MFA keeps working beside SSO, so you always have a way back in.
Production equipment, AGVs and other IoT gear often sit somewhere without a usable line: a temporary site, a customer floor, a dock. You arrange it yourself: buy a data SIM and a Teltonika RUT router, and the platform gives you everything to pair it with your appliance. From then on the router is monitored like any other device, and the equipment behind it is one click away in the dashboard.
Edge Monitor Gateway for sites without an appliance. Running Aegis in your datacenter or on a VPS, away from a site? Put an Edge Monitor Gateway on the site and it carries the monitoring over the same kind of tunnel, straight to your instance: your switches, access points and firewalls are polled as if Aegis stood next to them, and you manage the network from wherever you are, abroad included.
The RMS features and the Edge Monitor Gateway are included with every Aegis licence: no module to buy and no subscription per router. You buy the router yourself, a Teltonika RUT in the model that fits the site's traffic, plus a data SIM, and set it up with the instructions Aegis gives you. We can help to set it up for you at our hourly rate. The machines behind the router cost nothing extra, and only the router counts against your licence.
A site with three routers and six machines: three routers, three licence slots, nothing else on the bill.
The tunnel terminates on your own appliance: nothing for you to host elsewhere, nothing of ours in the path. The router and the SIM are yours; we advise the model, since a busier site needs a bigger one. Help with the setup, remote or on site, is charged at our hourly rate.
The operator never installs VPN software: they log in with MFA, open the dashboard and click through to the machine.
One product, one licence, one price. You choose a deployment, not a different Aegis, and your configuration and history move with you if you switch later.
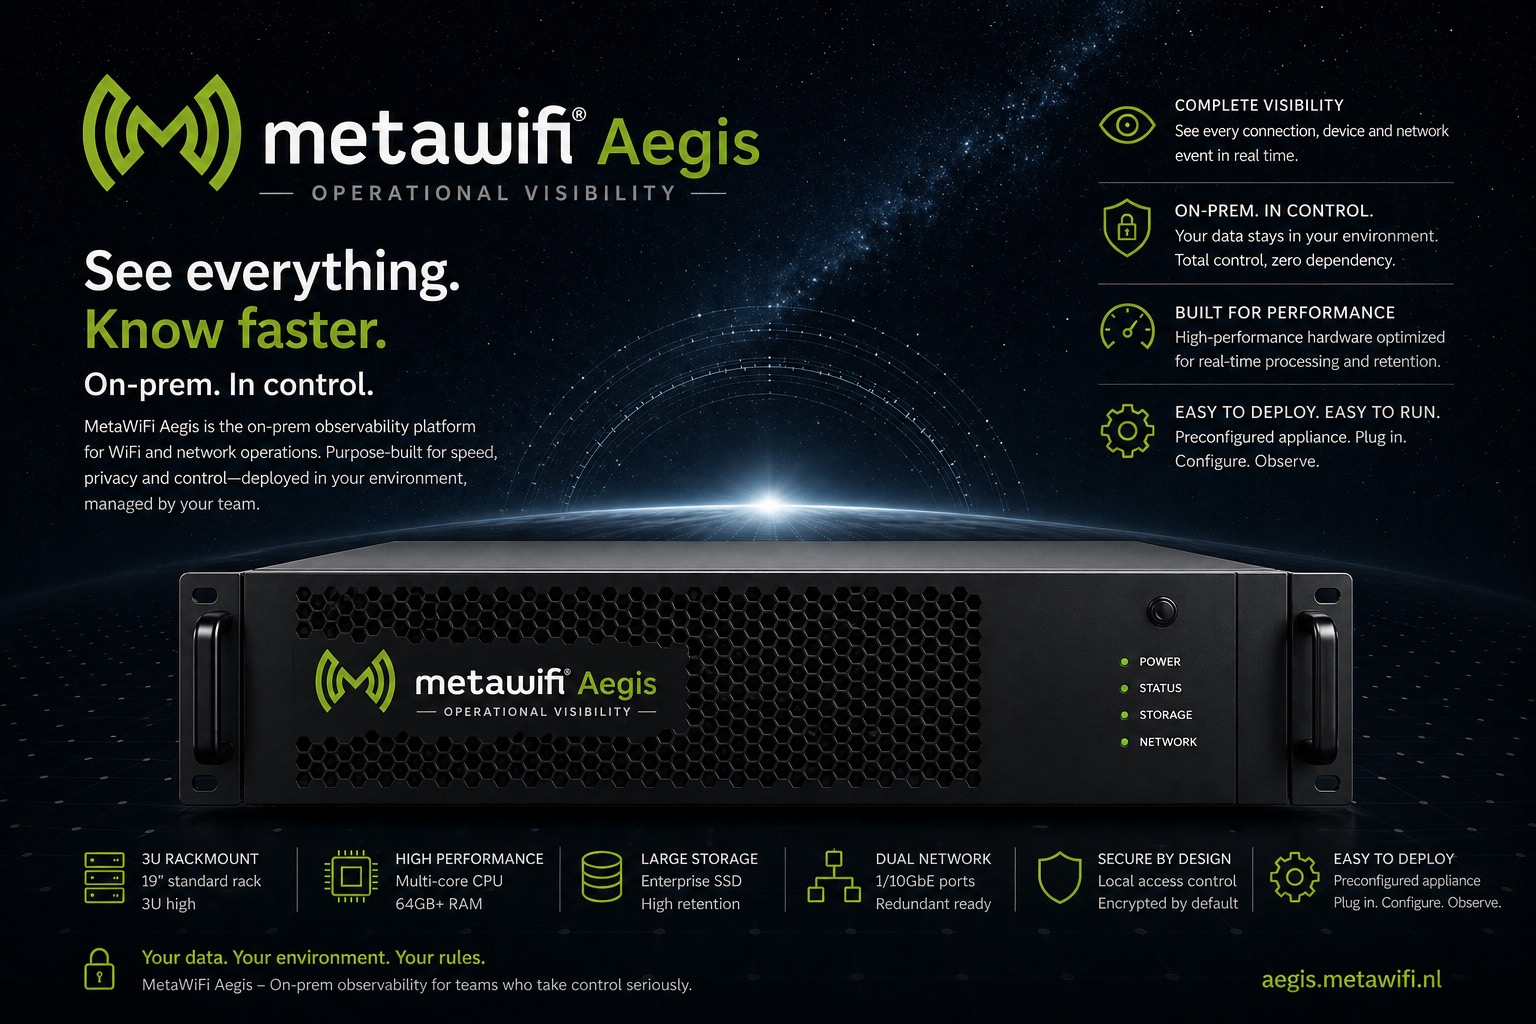
Aegis runs entirely inside your own environment: as a virtual appliance (.OVA) on your existing VMware, vSphere or Proxmox hosts, as an installer on any Ubuntu server or VPS, or on a dedicated physical appliance if you prefer one. No external dependencies, no data leaving your network.
Run Aegis once, as a VM, on a VPS or on an appliance. Every other location joins the same dashboard with an Edge Monitor Gateway: a compact Teltonika router that dials out to your instance and carries the monitoring for that site.
MetaWiFi Aegis is a European-built platform developed in the Netherlands, giving organisations control, transparency and alignment with European standards.
Three ways to deploy. Choose what fits your environment; a free 30-day trial licence key is included with all of them.
Pre-built virtual appliance, import and run in minutes.
30-day free trial. Get a PRO license →
One command on any Ubuntu 20.04/22.04/24.04 server or VPS. No hypervisor needed.
30-day free trial. Get a PRO license →
A dedicated physical appliance, pre-installed and ready to deploy in your network.
30-day free trial. Get a PRO license →
Onboarding a device used to take a lot of time, or got put off. Now I switch on discovery, Aegis configures what the switch needs with my own credentials, and that's it.
The unused-ports report showed in one go how many ports we still had free. Before, we worked that out switch by switch.
Licences from PRO 5 to PRO 1500, starting with a 30-day free trial. Switches, routers and WLCs each count as one device: APs are free. Pay per month and stop whenever you like, pay a year at once at 12% off, or commit to 2 or 3 years for up to 18% off per month.
All prices in EUR, excl. 21% VAT · monthly by direct debit, cancel anytime, or one payment per year at −12%.
Yes, with seamless integration in three clicks.
Yes. Aegis reads the deployment from the Primary PAN over the ISE OpenAPI (ISE 3.1 or later) with a read-only account and shows every node with its role: primary and secondary PAN, monitoring nodes (MnT), policy service nodes (PSN) and pxGrid nodes, each with its connection state. Next to that: the ISE version and patches, the certificates in use per node and when they expire, the status of the last configuration backup and the smart-licensing registration. A node that drops out, a certificate about to expire, a failed backup or an unregistered licence raises an alert in the same list as your switches and controllers. Aegis never changes anything on ISE.
Yes. The Edge Monitor Gateway dials out to your Aegis instance over an encrypted tunnel and keeps that connection alive; nothing has to be reachable from the internet at your site. Carrier-grade NAT on 4G, a router you do not control, a guest uplink: all fine, as long as outbound traffic to your instance is allowed. That outbound-only design is also why there is no inbound firewall rule to request and no port-forward to maintain.
No. Run Aegis once, as the OVA, on any Ubuntu server or VPS, or on an appliance. The only hardware at the other locations is an Edge Monitor Gateway. Moving the platform later, from a VPS into your own datacenter or the other way, is a migration, not a re-implementation: it is the same software, and your configuration and history move with you.
No. 4G is the fallback for sites without a usable line, but the gateway connects just as well over its wired WAN port on the site's own network, and then there is no data bundle to think about. The setup is identical either way.
MetaWiFi Aegis and Cisco Catalyst Center serve different primary purposes and can complement each other.
Cisco Catalyst Center is designed for: network deployment (Day 0/1), configuration management and automation and policy enforcement.
MetaWiFi Aegis is designed for: network monitoring (Day 2 operations), operational visibility across wired and wireless, and impact-based troubleshooting.
No. All collection runs from the Aegis appliance: SNMP v2c or v3 for switches, firewalls and load balancers, the REST API for Catalyst 9800 controllers and APIC, and ping for reachability. Catalyst switches and controllers can additionally stream telemetry to Aegis, and Aegis pushes that subscription to the device for you over SSH during onboarding. Nothing is installed on the devices.
Health, interfaces and environment are polled every 60 seconds over SNMP, and bandwidth counters every 5 minutes. Switches with streaming telemetry push their state every 30 seconds, which is why alerts on those switches land faster. Controllers and ACI fabrics are polled every 60 seconds. The intervals can be tuned under Admin → Advanced.
Everything stays on the appliance: configuration, metrics, alert history and the audit log. Nothing is sent to a cloud service. Retention follows the appliance size, 90 days on the Small tier, 180 on Medium and 365 on Large, and a larger disk buys more. Backups can run daily or weekly from the dashboard, encrypted, to a NAS or share of your choosing.
Switching is Cisco Catalyst 9000 and 2960-X/XR, wireless is the Catalyst 9800 controller (AireOS is not supported), ACI fabrics from APIC firmware 5.x and Cisco ISE from 3.1. Cambium Networks is supported without cnMaestro: XV access points, cnMatrix switches and NSE gateways over SNMP, with Aegis switching SNMP on for you over SSH. Around the Cisco estate Aegis also monitors Fortinet FortiGate firewalls and F5 BIG-IP load balancers over SNMP, Teltonika 4G routers through Aegis RMS, LoRa gateways via ChirpStack and Orb sensors. The docs keep the current list per model.
A switch, a wireless controller, a firewall, a load balancer, a Cisco ISE node, a Cambium cnMatrix switch or NSE gateway, and a Teltonika router (Aegis RMS or Edge Monitor Gateway) each take one slot. Access points and the machines behind a router are free. Beyond the limit nothing breaks: the extra devices are greyed out and left unpolled, and the License tab shows which ones. Raise the tier and they report again on the next cycle, without re-onboarding.
Yes. The dashboard opens on a site overview with a health score per location, and any device the appliance can reach over your WAN or VPN is monitored from the same install. For a branch without a route back, or a site on 4G, an Edge Monitor Gateway dials out to the appliance and brings that location in as a site of its own.
From Aegis to the devices: ICMP, SNMP on UDP 161, SSH on TCP 22 for onboarding, and HTTPS on TCP 443 to wireless controllers, the APIC and the Cisco ISE Administration Nodes (the ISE OpenAPI and ERS both run on 443). From the devices to Aegis, all optional: SNMP traps on UDP 162, syslog on UDP 514 and streaming telemetry on TCP 57500. Users reach the dashboard on 80 or 443. Outbound from the appliance: HTTPS to the licence server, and UDP 51820 (WireGuard) to the MetaWiFi support hub when you switch on support access. Inbound, only when you use Aegis RMS or an Edge Monitor Gateway: UDP 51820 from the routers, forwarded to the appliance. ICMP is required, since Aegis pings before it polls. The full table per protocol is in the documentation.
The OVA imports and installs fully offline. Outbound HTTPS is needed at licence activation, for the periodic licence check and to fetch updates, and that is the whole of it: no telemetry, metrics or device data leave your network. Updates are a single click under Admin → Update, take two to five minutes, and keep your configuration, licence and history.
Yes. Accounts are created by invitation and belong to the Admin group, with full access, or the Monitor group, which is read-only dashboards and alerts. Local accounts sign in with a password and a one-time code from an authenticator app (OTP), required for administrators. Instead of local accounts you can hand sign-in to Active Directory over LDAP, or to Entra ID, Okta or ADFS over SAML, with group membership deciding the role and no passwords stored in Aegis.
Alerts are Critical, Warning or Info and resolve themselves when the condition clears. When a device goes offline Aegis raises one alert for it and suppresses the uplink, access point and environmental alerts that follow from it. Planned maintenance windows, per site or per device, silence alerts for the duration, and only what passes the escalation rules, per device and per time of day, reaches your on-call tool.
Small, up to 150 devices and 1 000 wireless clients: 4 vCPU, 8 GB and a 100 GB SSD. Medium, up to 500 devices and 3 000 clients: 8 vCPU, 16 GB, 250 GB. Large, up to 2 000 devices and 10 000 clients: 16 to 24 vCPU, 64 GB, 1 TB NVMe. Size on whichever row is highest: wireless clients drive far more load than device count, so a campus with 120 switches and 3 000 clients is a Large.
The trial key gives every feature for 30 days, without a credit card. When you buy PRO the key arrives by email; enter it under Admin → License and the dashboard confirms the tier and device limit on the spot. Devices, sites, users and the history you built up during the trial stay as they are.
Tell us about your environment and we will get back to you within a few hours, with a walkthrough against a real network if you want one.